Excel Spreadsheet for HR: How to Track Leaves, Headcount and Onboarding Like a Pro
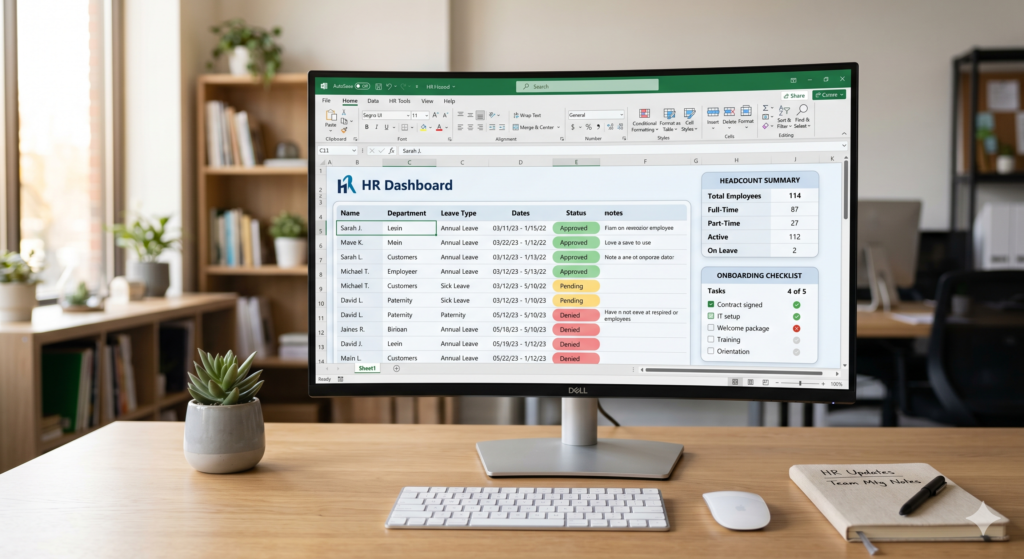
Ready to master HR through Excel? Managing people is one of the most important jobs in any company and also one of the most complex. HR teams deal with dozens of moving parts every single day: who is on leave, how many people are actually on the team, and whether new hires are getting properly […]
Financial Modelling Excel: Understand 7 Building Blocks of a Clean Model
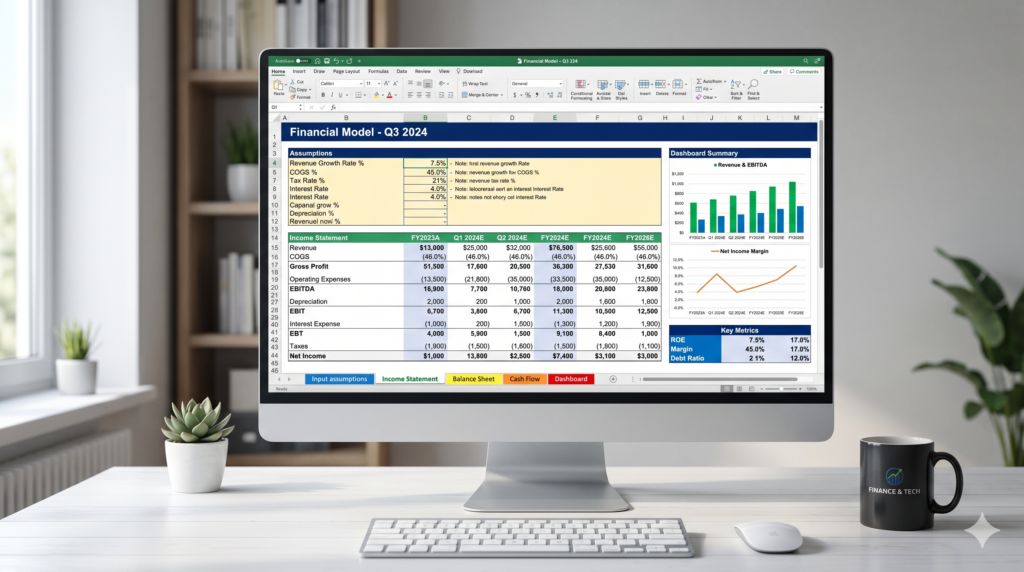
Understanding Financial Modelling in Excel Excel financial modelling is one of the most valuable skills in business and also one of the most commonly done wrong. Whether you are projecting revenue, running a scenario analysis, or evaluating an investment, a poorly structured model can lead to decisions built on broken logic and hidden errors. The […]
Power Apps with Canvas Apps vs Model-Driven Apps? Through a Power Apps Specialist perspective

INTRODUCTION If you have ever opened Microsoft Power Apps and faced the first question: “Canvas or Model-Driven?” you are not alone. Many teams spend hours going back and forth before making a choice, and some even build the wrong type, only to start over later. In this blog our Power Apps specialists will explain the […]
How Power BI specialists fit Desktop vs Service version together

Learn the usage of each version When businesses first start with Power BI, one question comes up almost immediately: what exactly is the difference between Power BI Desktop and Power BI Service? Moreover, which one should you actually be using? The short answer is that both tools are essential, and Power BI specialists always use […]
Excel Macros vs Power Automate: When and Which Automation Tool Should You Use?
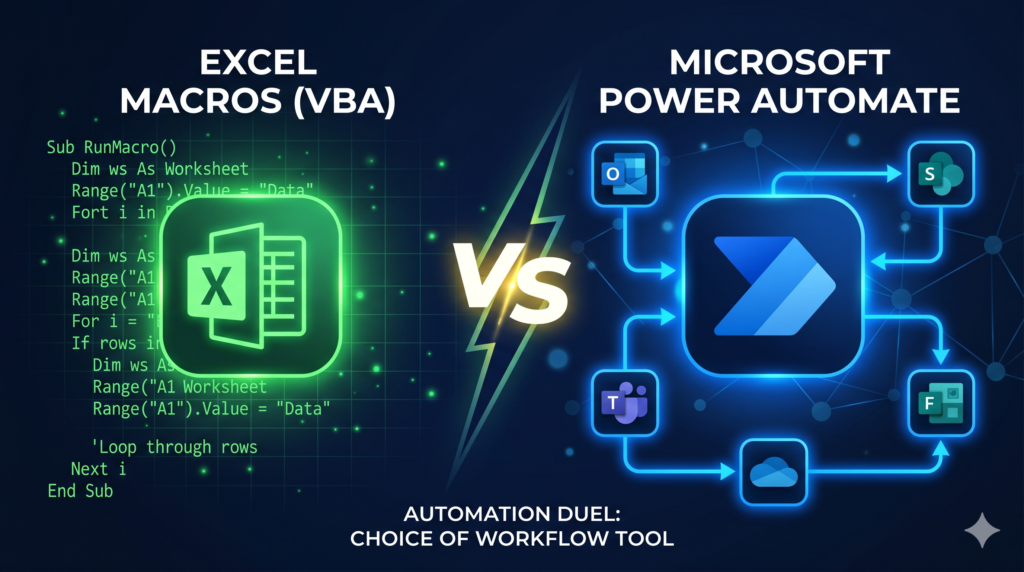
Choosing the best tool to Automate Excel Spreadsheets If you have ever sat in front of a screen clicking the same buttons over and over, you already know the frustration that automation is built to solve. However, choosing the wrong tool can cost you time, money, and headaches. So, should you automate Excel spreadsheets using […]
How to Build a Sales Pipeline Tracker in Excel: A Step-by-Step
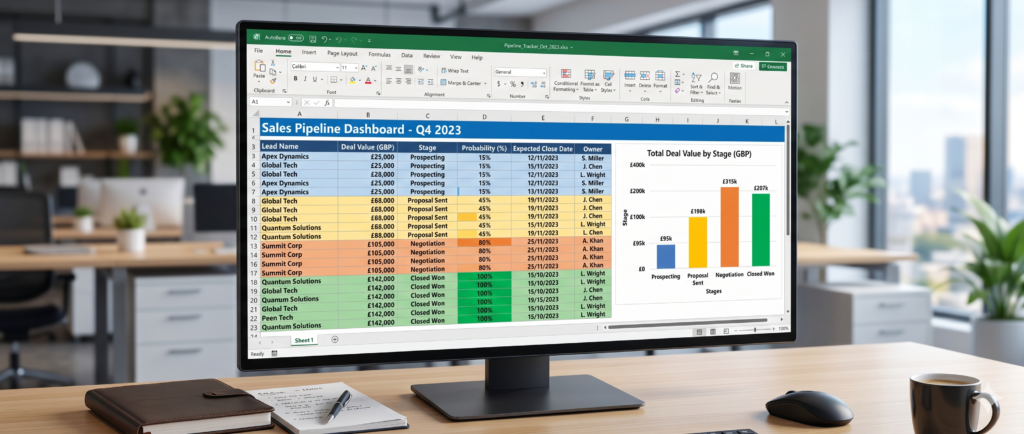
Introduction: How to build a custom excel spreadsheet (Sales-based) A well-managed sales pipeline is the backbone of any growing business. Without a clear view of where every deal stands, it is easy to lose track of follow-ups, miss close dates, or misread your revenue forecast. The solution does not have to be expensive. In this […]
Top 10 Excel Automation Use Cases for Accountancy Practices
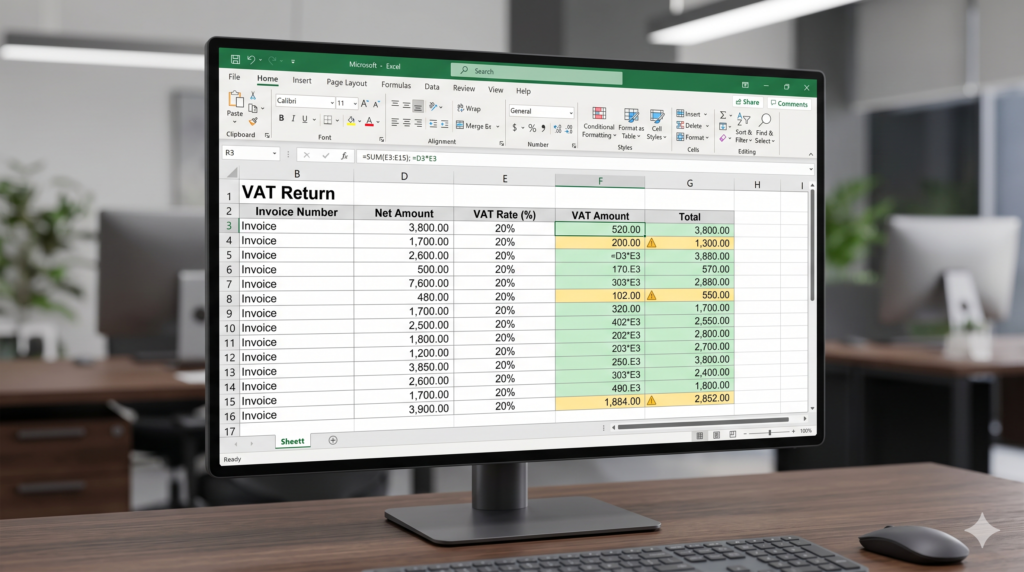
How to automate Excel spreadsheets for accountancy? Running an accountancy practice means dealing with enormous volumes of data every single day. Between invoices, payroll records, tax filings, and client reports, the manual workload can feel relentless. The good news? You can automate Excel spreadsheets to handle most of the repetitive work and the impact are […]
How to Automate Excel Spreadsheets and Handle 100k+ Rows Without It Crashing – 6 tips to make it work.

When should you consider automation for your Excel Spreadsheet? You paste 110,000 rows into Excel and the whole thing freezes. The spinning cursor appears. You wait. You close it. You reopen it. The cycle repeats. This is one of the most common pain points for analysts and operations teams working with real-world data. Excel was […]
Excel vs Power BI Specialist: Which do you need?

Introduction You open Excel. You build a table, apply a few formulas, and everything looks fine until your manager asks why the sales numbers changed three days after the report was “done.” Sound familiar? Well, a Power BI specialist could’ve helped you answer that. Both Excel and Power BI are Microsoft tools. Both handle data. […]
Pivot Table Best Practices: Speed, Structure, and the Mistakes You Must Avoid
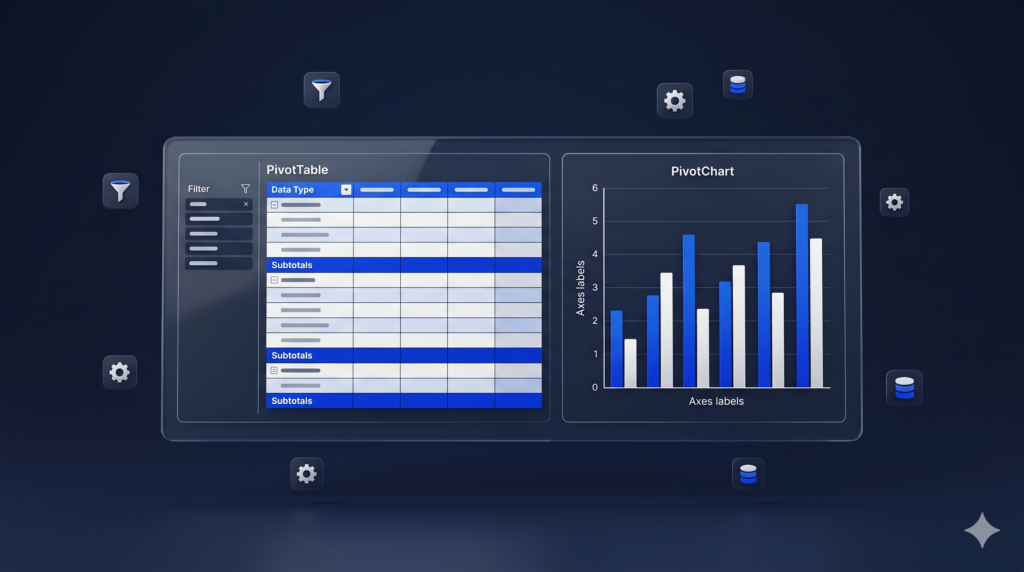
Understanding the feature A Pivot Table can summarize thousands of rows of data in seconds. However, without a proper foundation, it can also become a source of confusion, errors, and slow performance. Pivot Table best practices exist precisely to prevent that. This tutorial covers everything from how to prepare your data correctly to which configuration […]