Key takeaways
- There is no single winner: many mature finance teams use Excel for modelling and analysis and Power BI for recurring reporting and distribution.
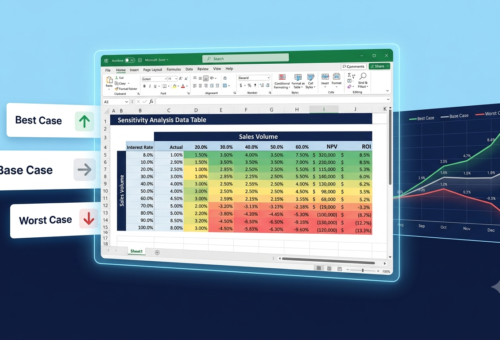
- Excel leads when flexibility and formula depth matter, such as complex interlinked models, amortisation schedules, scenario analysis and static reports that are printed or embedded in board presentations.
- Power BI wins for monthly reporting with multiple data sources or large datasets, refreshing dashboards on schedule so every team member sees the same numbers.
- Decide by asking how your data arrives, how many people consume the final report, and whether it is a one-off analysis or a recurring monthly deliverable.

Starting the knowledge
Every finance team faces the same tension at month-end: you need accurate, clear, and fast reports. The question, however, is whether Excel or Power BI should be your go-to tool. Both have earned their place in finance departments worldwide, yet they serve very different purposes. In this tutorial, you will learn from specialists in Excel and Power BI how each tool handles the monthly reporting cycle, where each one shines, and, most importantly, how to decide which one is right for your team right now.
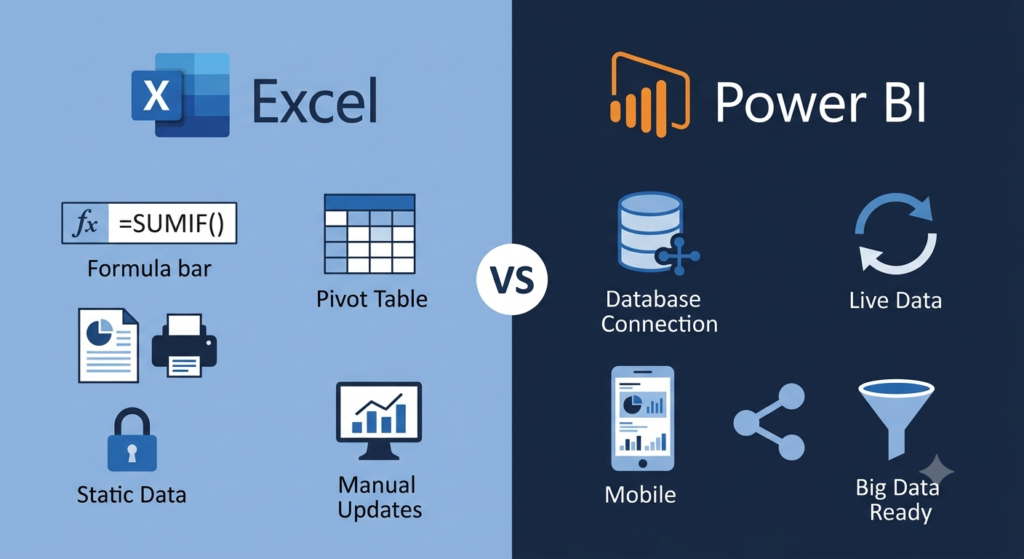
Excel vs Power BI for finance teams at a glance
This comparison shows where each tool fits in the monthly finance reporting cycle.
| Criterion | Excel | Power BI |
|---|---|---|
| Built for | Individual analytical work and financial modelling | Business intelligence at scale |
| Data updates | Manual updates, often by copying and pasting | Pulls data from sources and refreshes on schedule |
| Data sources | Practical with a limited number of sources | Multiple sources at once, such as ERP, CRM and accounting |
| Consistency | Version control problems when several people edit | Defined data models; everyone sees the same numbers |
| Output | Static, printable reports; embeds in Word and PowerPoint | Interactive dashboards with drill-down filters |
| Best for | Complex models, amortisation schedules, scenario analysis | Recurring, multi-stakeholder monthly reporting |
Understanding What Each Tool Is Built For
Excel has been the backbone of financial modeling for decades. It gives analysts total freedom: custom formulas, manual data entry, flexible layouts, and deep calculation logic. For static reports, one-off analyses, and detailed models, Excel remains incredibly powerful. Moreover, most finance professionals already know it well, which lowers the learning curve considerably.
Power BI, on the other hand, was designed to connect, transform, and visualize large volumes of data automatically. Instead of manually updating a spreadsheet every month, Power BI pulls data from your sources and refreshes your dashboards on schedule. Therefore, if your team spends hours copying and pasting data into Excel before building a report, Power BI addresses that problem directly.
Both tools can produce monthly financial reports. However, the way they get there is fundamentally different, and that difference matters more than most finance leaders realize.
Where Excel Still Leads in Finance Reporting
Excel wins when flexibility and formula depth are non-negotiable. Complex financial models with hundreds of interlinked cells, custom amortization schedules, and scenario analysis still belong in Excel. Additionally, when reports need to be printed and distributed as static documents, Excel formatting gives you precise control that Power BI does not.
For smaller finance teams dealing with a limited number of data sources, building bespoke spreadsheets in Excel remains a practical and cost-effective choice. Furthermore, Excel integrates naturally with Word and PowerPoint, making it easy to embed tables and charts in board presentations.
The challenge, however, arrives when your data grows. When multiple people edit the same file, version control becomes a nightmare. When source data changes, every formula must be re-checked. Consequently, Excel can turn a reporting process into a manual, error-prone routine.
Where Power BI Outperforms Excel for Monthly Reporting
Power BI becomes the clear winner when your reporting involves multiple data sources, large datasets, or a need for real-time visibility. Instead of waiting for an analyst to compile numbers manually, a Power BI dashboard can show live figures from your ERP, CRM, and accounting system simultaneously. As a result, finance leaders can make decisions based on current data, not last week’s export.
Another advantage is consistency. Because Power BI reports are built on defined data models, every team member sees the same numbers. Also, interactive filters allow managers to drill down into specific departments, products, or time periods without requesting a new spreadsheet version each time.
Hiring specialists in Power BI to build and maintain your dashboards pays off especially when your team generates the same reports repeatedly each month, because automation reduces both time and human error significantly.
Key Decision Factors for Finance Teams
Choosing between the two tools comes down to a few critical questions. First, consider how your data arrives: is it manually entered or does it come from connected systems? Second, evaluate how many people consume the final report: one person or an entire leadership team? Third, think about frequency: is this a one-time analysis or a recurring monthly deliverable?
For recurring, multi-stakeholder reporting with connected data, Power BI is the stronger choice. For deep, custom financial modeling with full formula control, Excel remains essential. Consequently, many mature finance teams use both: Excel for modeling and analysis, Power BI for reporting and distribution.
According to Microsoft’s own documentation (Power BI official Overview), Power BI is specifically designed for business intelligence at scale, while Excel is positioned for individual analytical work. See, specialists in Excel and Power BI are both a must in some cases.
The Right Combination Is the Real Answer
There is no single winner when comparing Excel and Power BI for finance teams. Instead, the smartest approach is understanding what each tool does best and applying them accordingly. Excel remains irreplaceable for financial modeling and static deliverables. Power BI, in turn, transforms your monthly reporting into an automated, accurate, and interactive experience that scales with your business.
If your team still spends multiple days each month building the same reports manually, that is a clear signal to explore a professional solution. Hiring specialists in Power BI or working with a team that can build custom excel spreadsheets for your specific needs can completely transform your reporting efficiency.
Sapphire Business Technology has helped over 500 satisfied clients optimize their Excel, Power BI environments and more. Whether you need to automate Excel Spreadsheets or build powerful Power BI dashboards, our team is ready to deliver a solution built around your business reality.