
Key takeaways
- DAX, the formula language of Power BI and Power Pivot, is easier for Excel users than expected because many core functions share familiar Excel logic.
- The key difference is that DAX works on whole columns and tables in a data model, and measures respond dynamically to the filters applied in a report.
- The first eight functions to learn are SUM, SUMX, CALCULATE, FILTER, RELATED, RELATEDTABLE, IF and DIVIDE, each mirroring Excel tools such as SUMIFS, VLOOKUP and IF.
- CALCULATE is the most important DAX function, and DIVIDE is best practice over the slash operator because it handles division by zero without errors.
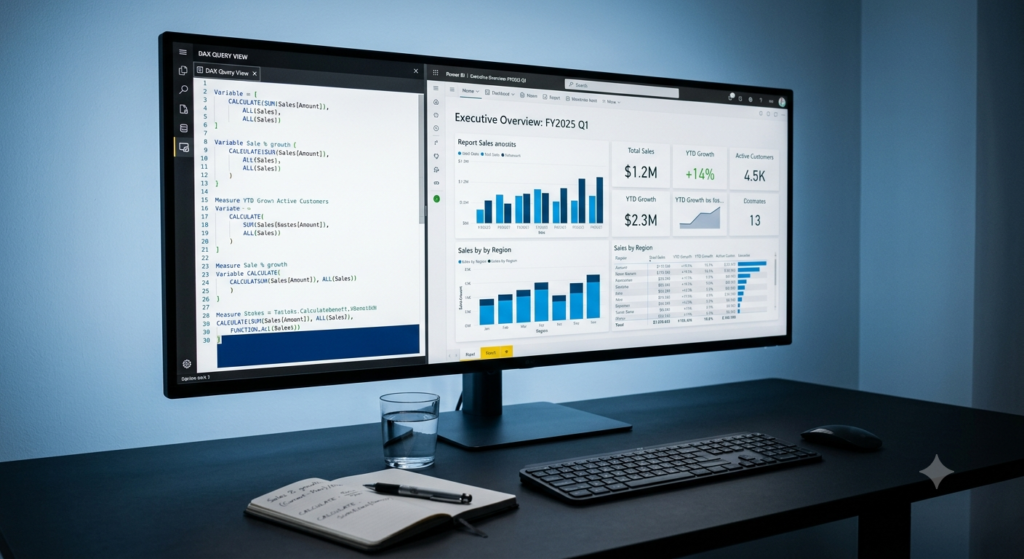
DAX basics for Excel users means learning the core functions of Data Analysis Expressions, the formula language of Power BI and Power Pivot, where formulas work on whole columns and tables in a data model instead of cell ranges.
If you already work with Excel formulas, learning DAX is more intuitive than you might expect. DAX, which stands for Data Analysis Expressions, is the formula language used in Power BI and Power Pivot. While it looks different at first glance, many of its core functions share the same logic as the Excel tools you already use every day.
DAX basics for Excel users always start in the same place: recognizing the patterns you already know, then understanding what is new. This tutorial walks you through the first eight DAX functions every Excel user should learn, with clear explanations and practical examples for each one.
In this article
By the end, you will understand not just what these functions do, but also when to use them and how they connect to your existing Excel knowledge.
Why DAX Feels Different From Excel Formulas
Before diving into the functions themselves, it helps to understand one key difference. In Excel, formulas work on cell ranges. In DAX, however, formulas work on entire columns and tables inside a data model.
This distinction changes how you think about calculations. For example, instead of summing cells B2 through B50, DAX sums an entire column from a named table regardless of how many rows it contains.
Additionally, DAX formulas are always written as either calculated columns or measures. Measures are particularly powerful because they respond dynamically to filters applied in your report. Therefore, the same measure can show total sales for the whole year or just for one region, depending on what the user selects.
With that foundation in place, the functions become much easier to grasp.
| DAX function | What it does | Excel equivalent or tip |
|---|---|---|
| SUM | Adds up all values in a column | Works almost identically to SUM in Excel |
| SUMX | Calculates row by row, then sums the results | Like a helper column plus SUM, in a single formula |
| CALCULATE | Changes the filter context of a calculation | The DAX answer to SUMIFS, with far greater flexibility |
| FILTER | Creates a filtered version of a table for another function | Use with CALCULATE when a condition is complex or uses several columns |
| RELATED | Pulls a value from a related table | Does the job of VLOOKUP by following the relationship in the data model |
| RELATEDTABLE | Returns all related rows from another table | Works in the opposite direction to RELATED |
| IF | Evaluates a condition and returns one of two outcomes | Works exactly like IF in Excel |
| DIVIDE | Divides and returns a value you define when the denominator is zero | Avoids the error Excel shows when dividing by zero |
DAX Functions 1 and 2: SUM and SUMX
SUM in DAX works almost identically to SUM in Excel. It adds up all values in a column.
Example:
Total Revenue = SUM(Sales[Revenue])
This measure sums every value in the Revenue column of your Sales table. Consequently, it updates automatically as filters change in your report.
SUMX, on the other hand, is more powerful. It lets you perform a row-by-row calculation first, then sum all the results.
Example:
Total Profit = SUMX(Sales, Sales[Revenue] – Sales[Cost])
In other words, SUMX subtracts cost from revenue for each individual row and then adds all those results together. This is similar to adding a helper column in Excel and then summing it, but in DAX you do it all inside a single formula.
DAX Functions 3 and 4: CALCULATE and FILTER
CALCULATE is the most important function in DAX. It changes the filter context of any calculation you give it.
Example:
Sales in 2024 = CALCULATE(SUM(Sales[Revenue]), Sales[Year] = 2024)
Furthermore, this means: sum revenue, but only for rows where the year equals 2024. In Excel, you would use SUMIFS for this kind of conditional sum. CALCULATE is DAX’s answer to that same need, but with far greater flexibility.
FILTER works as a companion to CALCULATE. It creates a filtered version of a table that another function can then use.
Example:
High Value Sales = CALCULATE(SUM(Sales[Revenue]), FILTER(Sales, Sales[Revenue] > 10000))
However, for simple conditions, using CALCULATE directly is usually cleaner and faster. Use FILTER when your condition is more complex or references multiple columns at once.

DAX Functions 5 and 6: RELATED and RELATEDTABLE
One of the biggest advantages of DAX over Excel is how it handles relationships between tables. In Excel, you use VLOOKUP to pull data from another table. In DAX, RELATED does the same thing, but cleaner.
Example:
Product Category = RELATED(Products[Category])
This pulls the category name from your Products table into a calculated column in your Sales table, following the relationship you defined in the data model. Moreover, there is no need to match on a key column manually. The relationship handles it automatically.
RELATEDTABLE works in the opposite direction. It returns all related rows from another table, which you can then use inside aggregation functions.
For instance:
Product Sales Count = COUNTROWS(RELATEDTABLE(Sales))
Created as a calculated column in the Products table, this counts how many sales transactions exist for each product. As a result, you get counts that respect your model relationships without writing complex nested formulas.
Not sure your tables and relationships are set up correctly for measures like these? Talk to our team about your data model before you build on it.
DAX Functions 7 and 8: IF and DIVIDE
IF in DAX works exactly like IF in Excel. It evaluates a condition and returns one of two outcomes.
Example:
Sales Status = IF(Sales[Revenue] > 5000, “High”, “Standard”)
This pattern will feel immediately familiar to any Excel user. Therefore, IF is usually the first DAX function beginners feel fully comfortable writing without guidance.
DIVIDE, however, is uniquely valuable in DAX. In Excel, dividing by zero causes an error. In DAX, the DIVIDE function handles this gracefully by letting you define what to return when the denominator is zero.
Example:
Profit Margin = DIVIDE(SUM(Sales[Profit]), SUM(Sales[Revenue]), 0)
In other words, if revenue is zero, the formula returns 0 instead of crashing with an error. Consequently, your reports stay clean and professional even with incomplete or edge-case data.
According to Microsoft’s official Power BI documentation, using DIVIDE instead of the slash operator is a recognized best practice specifically because of this error-handling behavior.
Putting DAX Basics Into Practice
Learning these eight functions gives you a strong starting point. Nevertheless, mastering DAX requires consistent practice with real data. The best way to learn is to recreate Excel reports you already understand, then rebuild them in Power BI using DAX measures.
Start with a simple sales table. Build SUM and CALCULATE measures first. Then add a DIVIDE to calculate margins. Over time, the logic becomes natural, and the limitations of Excel-only analysis become increasingly clear.
However, getting DAX models right, especially when dealing with complex relationships and large data volumes, often requires expertise that goes beyond self-teaching. Poorly structured data models lead to slow reports and incorrect numbers, both of which can have real business consequences.
When should you move beyond DAX basics?
DAX basics for Excel users are genuinely within reach. The eight functions covered here: SUM, SUMX, CALCULATE, FILTER, RELATED, RELATEDTABLE, IF, and DIVIDE, cover a wide range of real business scenarios. Each one builds directly on logic you already know from Excel, which means the learning curve is shorter than it seems from the outside.
When you are ready to move beyond tutorials and build production-grade Power BI reports tailored to your business, professional support makes all the difference. Sapphire Business Technology has partnered with more than 500 clients to design and deliver custom Excel and Power BI solutions built around real business needs. From data modeling to advanced DAX, the expertise is available to take your analysis to the next level.
Ready to turn the Excel reports you already understand into Power BI measures your team can trust? Tell us what you report on today and where the data comes from.
Frequently asked questions
What is DAX?
What is the difference between SUM and SUMX in DAX?
Why is CALCULATE the most important DAX function?
What replaces VLOOKUP in DAX?
Why use DIVIDE instead of the slash operator?
Content created by Sapphire Business Technology, based on over 2,000 client success stories in Excel, Power BI and others Microsoft 365 software on consulting and development.