INTRODUCTION
Every sales team runs on numbers. But when those numbers are scattered across emails, sticky notes, and disconnected files, deals slip through the cracks and commissions get miscalculated. Building a custom Excel spreadsheet for sales operations is one of the most practical steps you can take to bring clarity, speed, and accuracy to your team’s daily workflow.
In this tutorial, you will learn how to structure Excel to handle three core pillars of sales operations: commission calculation, revenue forecasting, and pipeline management. No advanced Excel experience required.
Why Excel Still Works for Sales Operations
Many sales teams assume they need an expensive CRM to stay organized. However, a well-built Excel spreadsheet for sales can deliver the same visibility at a fraction of the cost, especially for small and mid-sized teams.
Moreover, Excel gives you total control over formulas, layout, and logic, something that off-the-shelf tools rarely allow.
The challenge, though, is knowing where to start. A poorly organized spreadsheet becomes a burden rather than a tool. Therefore, structure comes first.
Start with three dedicated tabs:
- Tab 1: Commission Tracker
- Tab 2: Revenue Forecast
- Tab 3: Pipeline Board
Each tab serves a distinct purpose, and together they give sales managers a complete operational view.
Building Your Commission Tracker in Excel
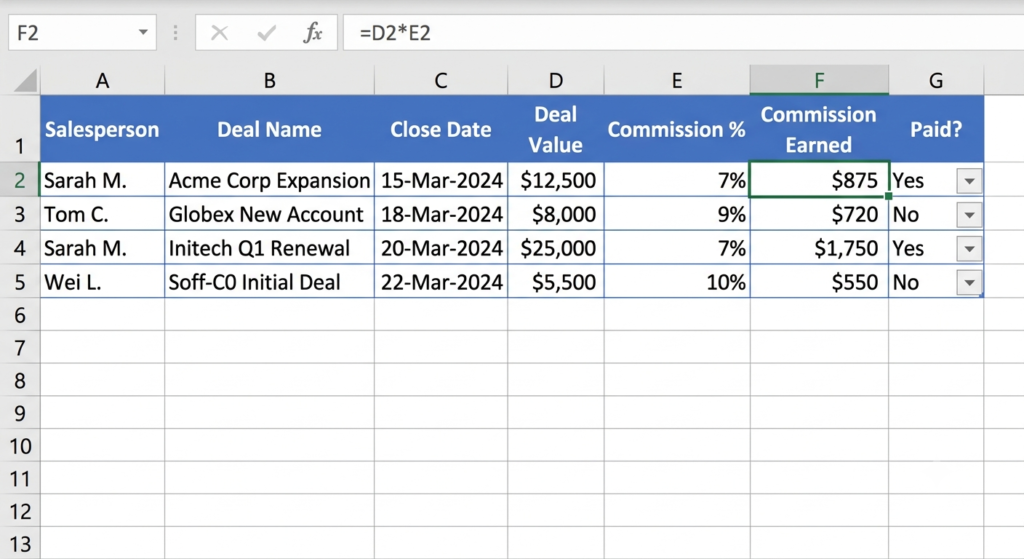
Commission errors destroy team morale. Consequently, getting this tab right is a priority. Begin by creating the following columns:
| Salesperson | Deal Name | Close Date | Deal Value | Commission % | Commission Earned | Paid? |
Use the formula below in the “Commission Earned” column:
=D2*E2
For example, if a deal is worth $10,000 and the commission rate is 8%, the formula returns $800 automatically. Additionally, use a dropdown in the “Paid?” column (Data > Data Validation > List: Yes / No) so you can track payment status at a glance.
To sum total commissions per salesperson, use SUMIF:
=SUMIF(A:A,”[Name]”,F:F)
This setup prevents disputes and creates a clear, auditable record.
Forecasting Revenue with Excel Functions
Revenue forecasting does not require complex software. Instead, you can build a solid model directly inside Excel using a few key functions. First, list your expected deals for the next 90 days in a table with these fields:
|Deal Name | Expected Value | Close Probability % | Weighted Value | Expected Month |
The “Weighted Value” column multiplies deal value by close probability:
=B2*C2
For instance, a $20,000 deal with a 50% chance of closing contributes $10,000 to your weighted forecast. Furthermore, using SUMIFS, you can filter totals by month:
=SUMIFS(D:D,E:E,”January”)
This approach gives leadership a realistic projection rather than an optimistic best-case scenario, which is exactly what good planning requires.
Managing Your Sales Pipeline Inside Excel
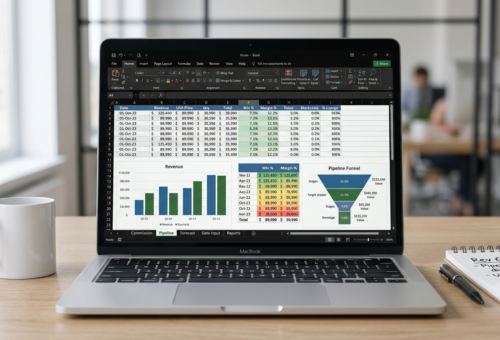
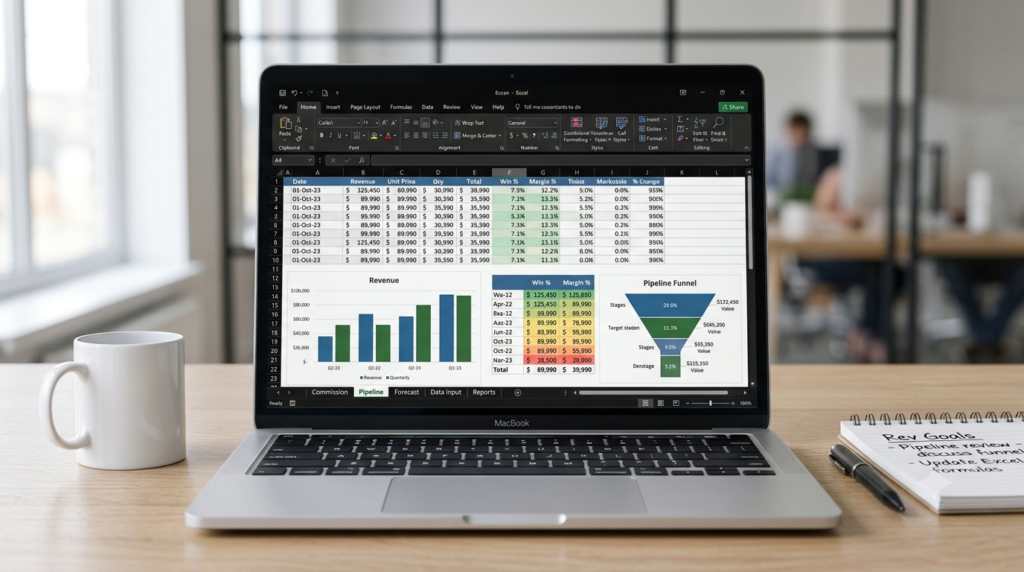
A pipeline tracker answers one question: where is every deal right now? Build this tab with the following structure:
| Deal Name | Company | Stage | Deal Value | Next Action | Owner | Last Updated |
For pipeline stages, use a dropdown list (Prospect, Qualified, Proposal Sent, Negotiation, Closed Won, Closed Lost). Then, apply conditional formatting to color-code each stage so that deals at risk become visible immediately.
To see your total pipeline value by stage, use SUMIF:
=SUMIF(C:C,”Proposal Sent”,D:D)
Also, use the DAYS function to calculate how long a deal has been sitting in a stage:
=DAYS(TODAY(),G2)
Deals inactive for 14 or more days deserve immediate attention.
According to HubSpot’s Sales Statistics report, sales reps spend an average of 21% of their day on administrative tasks. Streamlining operations with a structured spreadsheet directly recovers selling time.
When a Spreadsheet Is Not Enough
Excel is powerful, but even the best-built custom Excel spreadsheet has limits as teams scale. When your pipeline has 200+ deals, when multiple salespeople need to edit the same file simultaneously, or when your commission logic involves complex tiers and clawbacks, manual spreadsheets start to break down.
At that point, the smartest move is to bring in specialists. Working with experts who build custom Excel spreadsheets and automated sales tools means your team gets precision-built solutions, not generic templates that you adapt until they barely work.
Now that you know…
Sales operations live and die by the quality of the data behind every decision. Building a solid Excel foundation for commissions, forecasting, and pipeline management is not just a productivity win; it is a revenue protection strategy.
However, as your operation grows, complexity grows with it and a simple spreadsheet for Sales won’t be enough. At Sapphire Business Technology, with over 2,000 satisfied clients and deep expertise in custom Excel spreadsheet development and automation, we build tools that match exactly how your sales team works. No unnecessary complexity, no wasted time.
Ready to stop fighting your spreadsheets and start using them? Get in touch.