
Key takeaways
- Excel sensitivity analysis shows how changes in inputs such as sales volume or costs affect outputs like profit, using three native tools: Goal Seek, Data Tables and Scenario Manager.
- Goal Seek works backwards from a target, such as finding the units needed to reach a profit goal, but changes only one variable at a time.
- Data Tables calculate a full matrix of results for one or two variables at once, and conditional formatting can turn them into a visual sensitivity heatmap.
- Scenario Manager compares named cases such as Best, Base and Worst Case in a side-by-side summary table; as models grow, combining all three methods becomes standard practice.
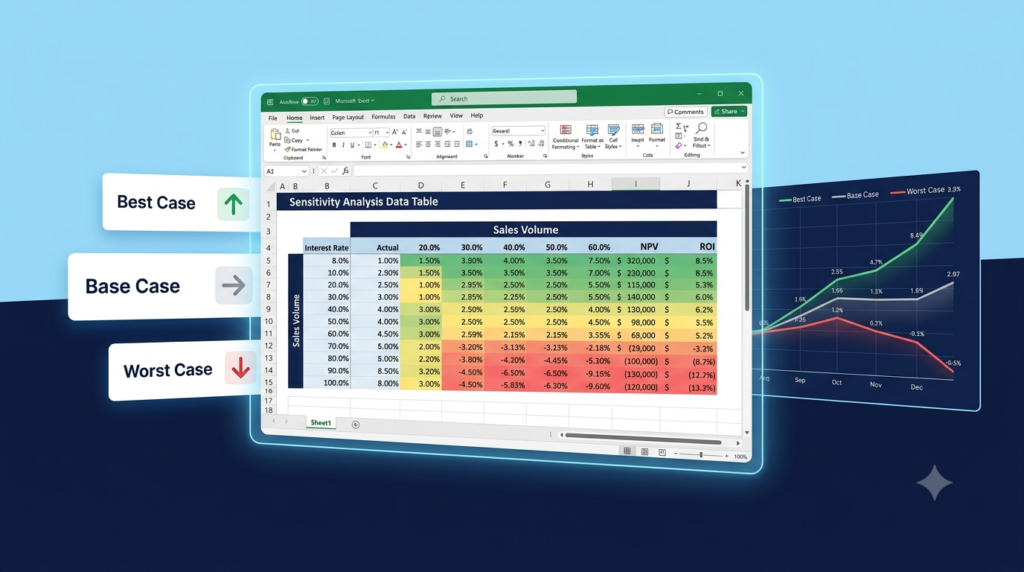
Excel sensitivity analysis measures how changes in inputs such as sales volume, price or costs affect an output such as profit or cash flow, using tools that are already built into Excel.
Business decisions rarely come with guarantees. So, what happens to your profit margin if sales volume drops 15%? What if raw material costs climb by 10% at the same time? Excel sensitivity analysis is the tool that answers these questions before reality does. In this tutorial, you will learn three practical methods to run sensitivity analysis directly inside Excel, step by step, even if you have never used these features before.
In this article
- What Is Excel Sensitivity Analysis and Why It Matters
- Method 1: Goal Seek for Reverse Sensitivity Analysis
- Method 2: Data Tables for Systematic Scenario Mapping
- Method 3: Scenario Manager for Named Business Cases
- Choosing the Right Method for Your Situation
- When should a sensitivity model be built for you?
What Is Excel Sensitivity Analysis and Why It Matters
Sensitivity analysis measures how changes in one or more input variables affect a specific output, like revenue, profit, or cash flow. In other words, it maps risk and opportunity across a range of possible scenarios.
For business owners, financial analysts, and operations managers, this kind of analysis is critical. For example, a pricing model that only works under perfect conditions is not a model at all; it is an assumption. Therefore, understanding the range of possible outcomes transforms guesswork into informed decision-making.
Excel offers three native tools for this purpose:
- What-If Analysis (Goal Seek)
- Data Tables (One-Variable and Two-Variable)
- Scenario Manager
Each method serves a different level of complexity. Consequently, knowing which to use in each situation is half the work.
Method 1: Goal Seek for Reverse Sensitivity Analysis
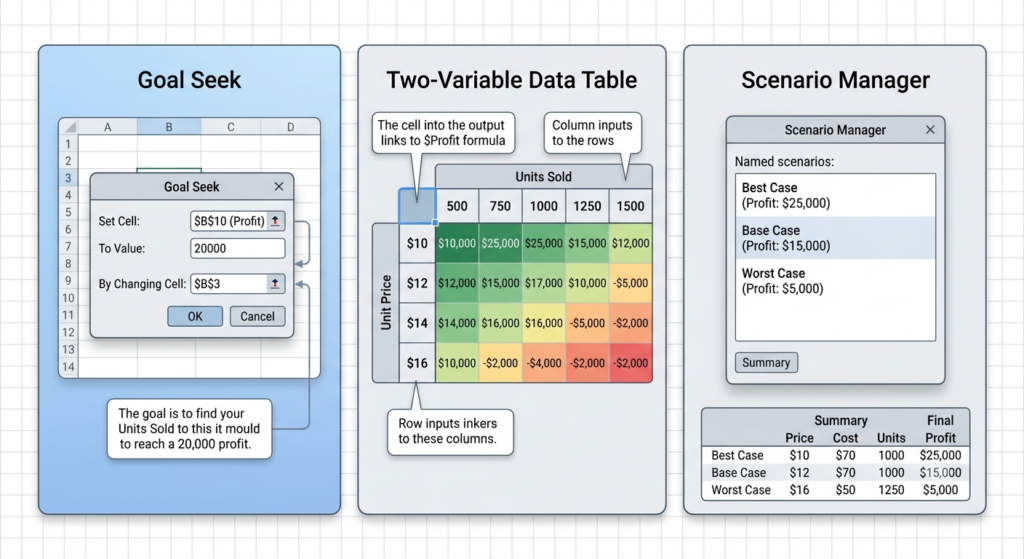
Goal Seek works backwards. Instead of asking “what is the output if I change this input,” you ask “what does this input need to be to reach a target output?” This makes it ideal for break-even and target-setting analysis.
How to use Goal Seek:
- Build a simple model. For example: Revenue = Units Sold x Price Per Unit, and Profit = Revenue – Fixed Costs.
- Go to Data > What-If Analysis > Goal Seek.
- Set Cell: your Profit cell. To Value: your target (for example, $50,000). By Changing Cell: your Units Sold cell.
- Click OK.
Excel will calculate exactly how many units you need to sell to hit that profit target. Additionally, you can run this multiple times with different target values to map a range of scenarios manually.
Limitation: Goal Seek changes only one variable at a time. For multi-variable analysis, use the methods below.
Method 2: Data Tables for Systematic Scenario Mapping
Data Tables are the most powerful built-in tool for Excel sensitivity analysis because they let you calculate an entire matrix of results automatically. You can test one variable (one-variable table) or two variables simultaneously (two-variable table).
Two-Variable Data Table Example:
Suppose your profit formula is: =Revenue – Fixed Costs, where Revenue = Units x Price.
Step 1: Build your base model in a cell, for example =B2*B3-B4.
Step 2: Create a table where rows list different unit prices and columns list different unit quantities.
Step 3: Place your profit formula in the top-left corner of the table.
Step 4: Select the full table range, go to Data > What-If Analysis > Data Table.
Step 5: Set Row Input Cell as your price cell, Column Input Cell as your quantity cell. Click OK.
Excel fills the entire table instantly. Furthermore, you can apply conditional formatting to color-code results: green for profitable outcomes, red for losses. This transforms your table into a visual sensitivity heatmap, making insights immediately clear for presentations and reports.
Rebuilding data tables by hand every time a forecast changes takes hours. Our specialists can build a sensitivity model around your own figures.
Method 3: Scenario Manager for Named Business Cases
Scenario Manager is best when you need to compare distinct, named situations rather than a continuous range. This is particularly useful for board presentations where you want to show Best Case, Base Case, and Worst Case projections clearly.
How to set it up:
- Go to Data > What-If Analysis > Scenario Manager.
- Click Add, name your first scenario (for example, “Best Case”), and select the cells that will change (units sold, price, cost).
- Enter the values for this scenario and save it.
- Repeat for “Base Case” and “Worst Case.”
- Finally, click Summary to generate a clean comparison table automatically.
The result is a structured, side-by-side comparison of all three scenarios, ideal for sharing with stakeholders who do not need to see the underlying formulas.
According to McKinsey & Company, companies that integrate scenario planning into their financial models make faster strategic decisions and recover more effectively from market disruptions. Sensitivity analysis is a core component of that discipline.
Choosing the Right Method for Your Situation
Not every analysis requires all three tools. To summarize: use Goal Seek when you have a specific target and need to work backwards. Use a Data Table when you need to visualize a full range of combinations at once. Use Scenario Manager when you need named, presentation-ready comparisons.
| Method | Best when | Variables tested | What you get |
|---|---|---|---|
| Goal Seek | You have a target and need to work backwards | One at a time | The input value needed to reach the target |
| Data Table | You need to see a full range of combinations at once | One or two | A matrix of results that can become a heatmap |
| Scenario Manager | You need named, presentation-ready cases | Several per scenario | A summary table comparing Best, Base and Worst Case |
However, as models grow in complexity, combining all three methods becomes standard practice. For instance, a financial model might use Goal Seek to set a pricing floor, a Data Table to map margin sensitivity across volumes, and Scenario Manager to present three strategic options to leadership.
When your models reach that level, manual setup starts consuming hours that your team should spend on analysis, not spreadsheet maintenance.
When should a sensitivity model be built for you?
Excel sensitivity analysis is one of the highest-value skills in any analytical toolkit. From simple break-even checks with Goal Seek to full scenario libraries in Scenario Manager, these three methods give you a structured way to stress-test assumptions before they become costly mistakes.
That said, building clean, reliable, and dynamic sensitivity models takes time to get right. At Sapphire Business Technology, with over 500 satisfied clients across finance, operations, and sales, we specialize in building custom Excel spreadsheets and automated analytical tools tailored to your specific business needs. Whether you need a ready-to-use sensitivity model or a full financial planning tool, our team builds it with precision.
Stop guessing. Start analyzing.
Want a sensitivity model your team can reuse every quarter instead of rebuilding it by hand? Tell us about your current spreadsheet.
Frequently asked questions
What is sensitivity analysis in Excel?
When should I use Goal Seek instead of a Data Table?
Can a Data Table test two variables at the same time?
How do I compare best, base and worst case scenarios in Excel?
How can I turn a Data Table into a sensitivity heatmap?
Content created by Sapphire Business Technology, based on our expertise serving over 500 satisfied clients.