Introduction
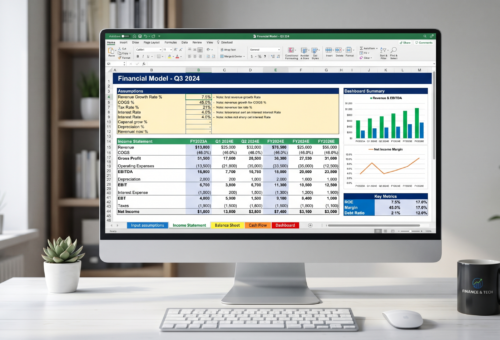
You open Excel. You build a table, apply a few formulas, and everything looks fine until your manager asks why the sales numbers changed three days after the report was “done.” Sound familiar? Well, a Power BI specialist could’ve helped you answer that.
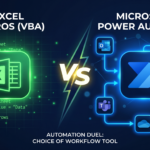
Both Excel and Power BI are Microsoft tools. Both handle data. But they solve very different problems. Knowing when to use each one can save hours of rework and prevent decisions based on outdated information.
This tutorial walks you through exactly when each tool wins, so you stop guessing and start choosing with confidence.

What Excel Does Best
Excel is arguably the most flexible data tool ever built. Furthermore, its strength lies in tasks that require direct manipulation, custom formulas, and fast one-off analysis.
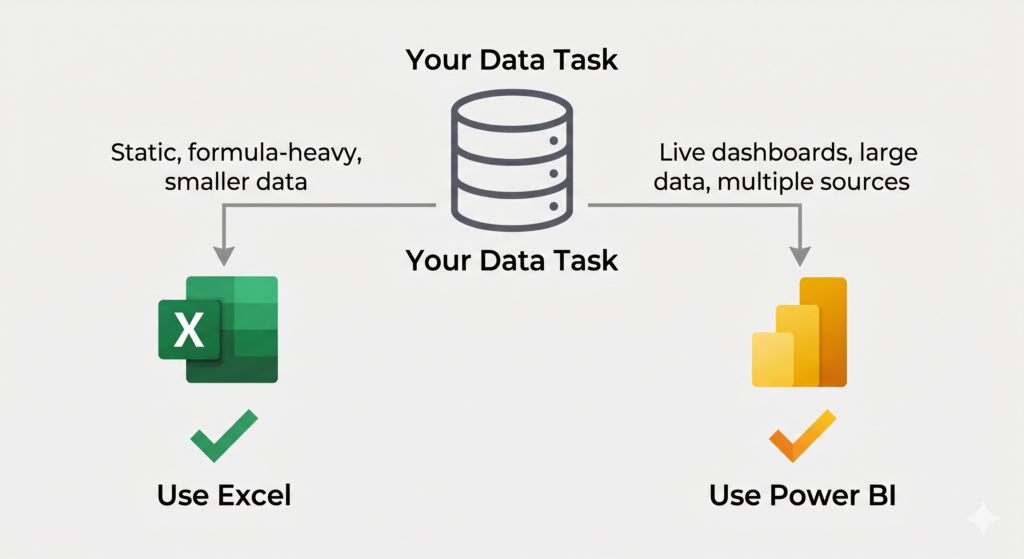
Use Excel when you need to:
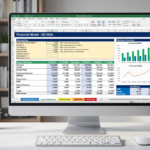
- Build financial models with complex nested formulas
- Create ad hoc calculations on smaller datasets (under 100k rows)
- Work with data that others will edit directly in cells
- Produce structured templates like invoices, budgets, or project trackers
- Collaborate with people who may not have access to BI tools
However, Excel starts showing cracks when your data grows or when multiple people need to see live, updated results simultaneously. Additionally, version control becomes a real challenge when files are emailed back and forth.
Where Power BI Takes Over
Power BI was built specifically for visualization and reporting at scale. Consequently, it shines in situations where Excel would require too many manual steps to maintain.
Consider Power BI when:
- Your dataset exceeds 100,000 rows and needs to stay fast
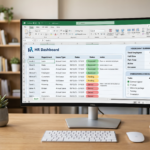
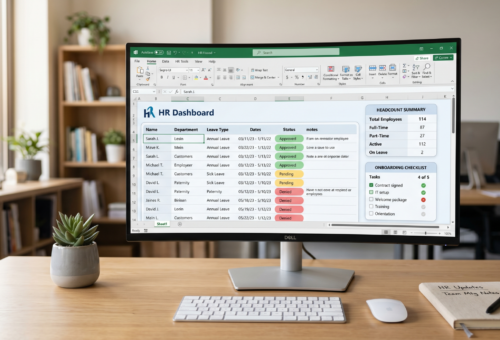
- Stakeholders need dashboards that refresh automatically from a data source
- You want to connect multiple data sources, like: SQL, SharePoint, Excel, web APIs
- Reports need to be shared securely with a large audience
- You need drill-down interactivity without building it manually
Moreover, Power BI’s DAX language lets you create calculated measures that update dynamically. In contrast, Excel formulas require manual adjustments every time the underlying data changes.
A Practical Scenario to Make This Concrete
Imagine a retail company tracking weekly sales across 15 stores. On one hand, an analyst uses Excel to model pricing scenarios for a single campaign that is a perfect Excel job. On the other hand, the operations manager needs a live dashboard showing which store is underperforming today: that is where a Power BI specialist earns their place.
Neither tool is superior. They work better together than apart. In fact, many organizations use Excel for input and modeling, then feed that data into Power BI for reporting.
The Real Cost of Using the Wrong Tool
Using Excel for enterprise-level reporting wastes hours on manual refreshes. Similarly, building complex financial models in Power BI creates unnecessary complexity where a spreadsheet would do the job in minutes.
The mistake most businesses make is choosing a tool based on familiarity rather than fit. Therefore, understanding the difference is not just a technical advantage, it is a business one.
According to Microsoft’s official Power BI documentation, Power BI is designed to “turn your data into coherent, visually immersive, and interactive insights.” Excel, by contrast, remains the go-to for “flexible data analysis and modeling.”
Are Power BI specialist or Excel Specialist ideal for you?
Both tools belong in a modern data toolkit. However, knowing which one fits your current challenge is what separates reactive teams from strategic ones. Excel handles precision and flexibility. Power BI handles scale and visibility. Used together, they cover nearly every business data need.
If your team is spending too much time maintaining reports manually or struggling to get clear visibility into your numbers, it may be time to bring in professionals. Sapphire Business Technology has helped over 2,000 satisfied clients build the right data infrastructure using both Excel and Power BI. From modeling to live dashboards, with solutions tailored to each business reality
Content created by Sapphire Business Technology, specialists in Excel and Power BI with over 2,000 satisfied clients.