Understanding the feature
A Pivot Table can summarize thousands of rows of data in seconds. However, without a proper foundation, it can also become a source of confusion, errors, and slow performance. Pivot Table best practices exist precisely to prevent that.
This tutorial covers everything from how to prepare your data correctly to which configuration choices affect speed, and which common mistakes quietly destroy the value of your reports. Additionally, whether you are building your first Pivot Table or your fiftieth, there is something here for every level.
By the end, you will have a clear framework for building Pivot Tables that are fast, clean, and easy to maintain.
Why Pivot Table Structure Starts Before You Click Insert
A Pivot Table best practice starts even before you create one as your source data must meet certain conditions. Consequently, many Pivot Table problems are actually source data problems in disguise.
A reliable source data set should follow these rules:
- Every column must have a unique, clear header in row one.
- There should be no blank rows or blank columns inside the data.
- Each column must contain only one type of data (dates only, numbers only, text only).
- Avoid merged cells entirely. They cause calculation errors and sorting failures.
Furthermore, using an Excel Table (Insert > Table) as your data source is one of the most underrated Pivot Table best practices. Tables expand automatically when new rows are added, so your Pivot Table always covers fresh data after a refresh.
How to Name and Organize Your Fields Correctly
Once your source is clean, the way you organize fields inside the Pivot Table determines how readable and useful the output becomes.
Three principles to follow:
First, keep your Rows area simple. Using more than two or three row fields creates nested groupings that are hard to read. If you need more depth, consider using slicers or filters instead.
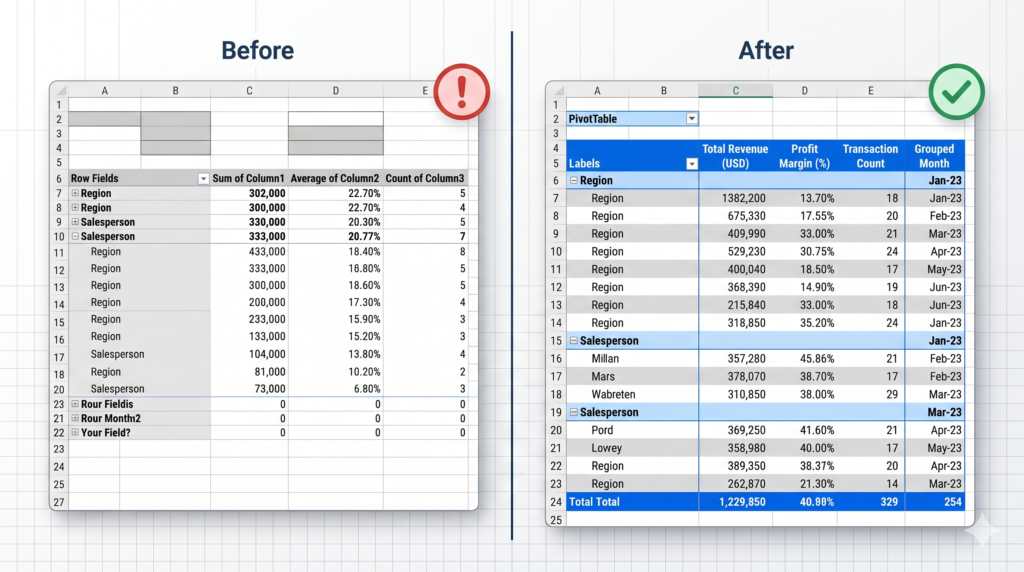
Second, place calculated items in the Values area with clear custom names. Instead of leaving a field named “Sum of Sales,” rename it to “Total Revenue (USD)” so it communicates its meaning at a glance.
Third, always place date fields in Columns or Rows with grouping enabled. Excel can automatically group dates by year, quarter, and month. However, this only works when the date column is formatted as an actual date and not as text.
Speed Optimization – What Slows Pivot Tables Down
Performance is one of the most overlooked aspects of Pivot Table best practices, especially when working with large data sets.
The following factors significantly slow down Pivot Table refresh and interaction:
Volatile formulas in the source data: Functions like NOW(), TODAY(), RAND(), or INDIRECT() recalculate constantly, forcing Excel to work harder every time the Pivot Table refreshes. Therefore, replace these with static values where possible.
Too many calculated fields: Calculated fields inside Pivot Tables are convenient, but they can slow things down considerably when the data set is large. Consider moving complex calculations to your source table instead.
Multiple Pivot Tables sharing one large cache: While cache sharing saves memory, updating one Pivot Table can unexpectedly affect others. As a result, manage shared caches carefully and understand which tables are linked.
For large data sets (over 100,000 rows), consider using Power Query to shape and clean data before loading it into the Pivot Table. This keeps your workbook fast and your Pivot Table focused only on summarization.
The Most Common Pivot Table Mistakes and How to Fix Them
Even experienced users make mistakes with Pivot Tables. However, most of them follow predictable patterns that are easy to avoid once you know what to look for.
Mistake 1 – Not refreshing the Pivot Table after data changes.
Excel does not update Pivot Tables automatically by default. Right-click and select Refresh, or enable automatic refresh on file open under Pivot Table Options.
Mistake 2 – Using (blank) rows in reports.
Blank rows in the source data create a “(blank)” entry in the Pivot Table. Always remove or fill blank rows before creating your report.
Mistake 3 – Mixing number formats in the same column.
If some cells are stored as numbers and others as text (a common import issue), your Pivot Table will produce incorrect totals or show separate rows for what should be the same value.
Mistake 4 – Hardcoding filters instead of using slicers.
Manual filter selections are invisible to the reader and easy to accidentally leave in place. Slicers, on the other hand, show exactly what is being filtered, making your reports more transparent and user-friendly.
Mistake 5 – Ignoring the “Show Values As” option.
Many users only use Pivot Tables to show raw totals. However, the Show Values As option lets you display values as percentages of totals, running totals, rank, or difference from a baseline. These options dramatically increase the analytical depth of your reports without any additional formulas.
Formatting Rules That Keep Pivot Tables Professional
A Pivot Table that is hard to read loses its purpose. Therefore, formatting is not just aesthetic. It is functional.
Key formatting practices to apply consistently:
Apply a Pivot Table style that uses banded rows. This makes large tables significantly easier to scan. Styles are available in the Design tab when a Pivot Table is selected.
Disable “AutoFit column widths on update” if you have customized column widths. Otherwise, Excel overwrites your formatting every time you refresh. Find this setting under Pivot Table Options > Layout and Format.
Format all value fields explicitly. Do not rely on the source data format to carry through. Set number formats directly on each value field using Value Field Settings > Number Format.
Additionally, consider hiding the field headers when presenting Pivot Tables to non-technical stakeholders. The label “Row Labels” and “Column Labels” confuse most readers who are not familiar with Excel’s interface.
When Your Pivot Table Needs More Than Excel Can Offer
Pivot Tables are powerful within Excel’s boundaries. However, for organizations managing large volumes of data, multiple data sources, or real-time reporting needs, Excel alone may not be enough.
This is where tools like Power BI become essential. They extend the logic of Pivot Table best practices into a fully scalable business intelligence environment. Hiring a Power BI specialist or working with Excel specialists ensures your reporting infrastructure matches your actual business complexity.
Source
For official guidance on Pivot Table creation and configuration options, refer to Microsoft’s documentation:
Microsoft Support – Create a Pivot Table to analyze worksheet data
Conclusion: Build Pivot Tables That Work For You, Not Against You
Throughout this tutorial, you covered the full landscape of Pivot Table best practices: clean data structure before creation, proper field organization, speed optimization strategies, common mistakes to avoid, and professional formatting principles.
Pivot Tables are one of Excel’s most valuable tools, but they require the right foundation to deliver real results. When that foundation is missing, reports become unreliable and maintenance becomes a burden.
If your team is spending too much time fixing spreadsheets instead of reading insights, it may be time to bring in expert support. Sapphire Business Technology has helped more than 2,000 satisfied clients build custom spreadsheets and structured reporting environments that scale with their business. Whether you need to build a custom Excel spreadsheet from scratch or optimize an existing system, our specialists are ready to help.
Content created by Sapphire Business Technology, based on over 2,000 satisfied clients and deep expertise in Excel, Power BI and data solutions.