Introduction
Most users know conditional formatting in Excel as the feature that turns cells red when something goes wrong. However, this tool is far more powerful than that. In fact, conditional formatting in Excel can do things most people never even try, from building visual dashboards to flagging data entry errors automatically.
This tutorial walks you through 12 practical use cases. Each one is designed to be applied directly to your work, even if you are not an advanced Excel user. Furthermore, by the end, you will see how these techniques connect to a larger strategy for building truly professional spreadsheets.
Let us start from the beginning and move step by step.
What Is Conditional Formatting in Excel?
A heatmap uses a color gradient to show intensity across a data set. Therefore, instead of scanning numbers one by one, you can see patterns instantly.
How to apply it:
- Select your data range.
- Go to Conditional Formatting > Color Scales.
- Choose a two or three-color gradient.
This is especially useful for sales performance tables, where you want to identify top and bottom performers at a glance. As a result, decision-making becomes faster and more visual.
Use Case 2 – Tracking Deadlines With Date-Based Rules
You can use conditional formatting to highlight past-due dates automatically. Consequently, your team never misses a deadline buried in a large task list.
How to apply it:
- Select your date column.
- Go to Conditional Formatting > Highlight Cell Rules > A Date Occurring.
- Set a rule for “yesterday” or use a custom formula such as =A2<TODAY().
Dates in the past turn red. Upcoming dates within seven days can turn yellow. Current dates stay green. This three-color system is simple, clear, and extremely effective.
Use Case 3 – Highlighting Duplicate Values
Duplicate entries in a data set can cause serious reporting errors. Fortunately, conditional formatting in Excel makes it easy to spot them without any manual review.
How to apply it:
- Select your data column.
- Go to Conditional Formatting > Highlight Cell Rules > Duplicate Values.
- Choose your highlight color.
Every repeated value gets flagged immediately. Moreover, this works across thousands of rows in seconds, something no manual review could match.
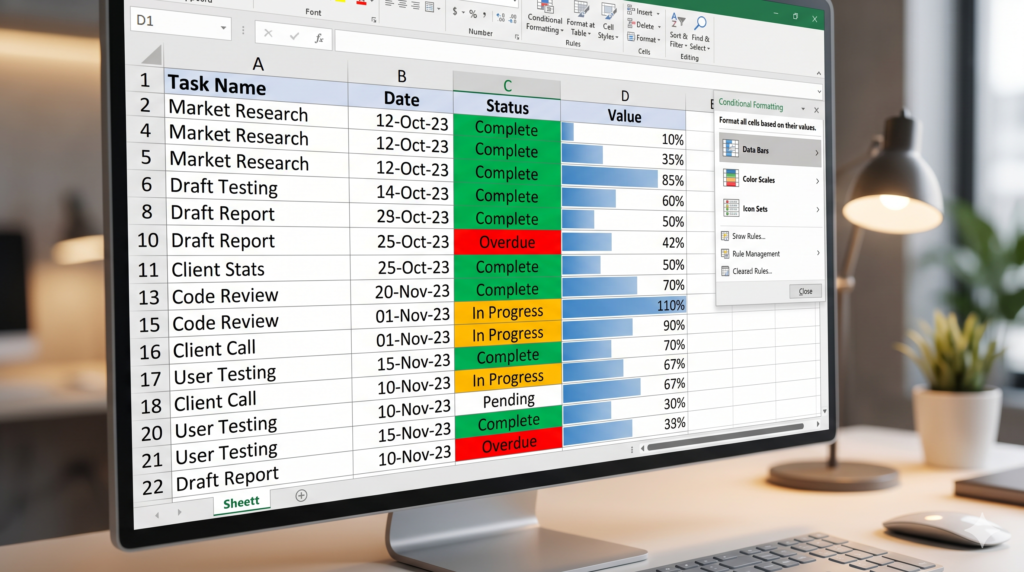
Use Case 4 – Visualizing Progress With Data Bars
Data bars display a horizontal bar inside each cell, proportional to the cell’s value. As a result, your spreadsheet begins to look like a mini bar chart without leaving the table.
How to apply it:
- Select the numeric column.
- Go to Conditional Formatting > Data Bars.
- Choose solid fill or gradient.
This is ideal for budget tracking, KPIs, or any numeric comparison table. Additionally, it reduces the need to create separate charts for quick overviews.
Use Case 5 – Using Icon Sets for Status Indicators
Icon sets replace numbers or text with visual icons, such as arrows, traffic lights, or checkmarks. Therefore, your stakeholders can read a report without needing to interpret every value.
How to apply it:
- Select your range.
- Go to Conditional Formatting > Icon Sets.
- Choose your icon style and define thresholds.
For instance, a three-color traffic light icon set can represent low, medium, and high performance levels. This works perfectly in executive dashboards and weekly review reports.
Use Case 6 – Flagging Data Entry Errors
When working with structured data, you can use conditional formatting in Excel to highlight cells that do not match expected formats or fall outside valid ranges. Consequently, errors get caught before they cause bigger problems.
How to apply it:
Create a custom formula rule. For example, to flag any value outside 1 to 100 in column B:
=OR(B2<1,B2>100)
Any cell that breaks the rule gets highlighted instantly. Furthermore, this can be combined with data validation to create a full error-prevention system.
Use Case 7 – Comparing Two Lists
You can use conditional formatting to visually identify items that appear in one list but not another. This is extremely useful when reconciling inventory, customer lists, or transaction records.
How to apply it:
Use the COUNTIF formula as a conditional rule:
=COUNTIF($B$2:$B$100,A2)=0
This highlights every value in column A that does not appear in column B. As a result, you can identify missing or mismatched records without writing complex lookup formulas.
Use Case 8 – Formatting Entire Rows Based on One Cell
Instead of highlighting a single cell, you can apply formatting to an entire row based on one condition in a specific column. This makes row-level status immediately visible.
How to apply it:
- Select the full table range.
- Create a custom formula rule, for example: =$C2=”Cancelled”
- Apply the desired formatting.
Now every row where column C says “Cancelled” turns gray. Moreover, this keeps your table highly readable even as it grows with new records.
Use Case 9 – Top and Bottom Performers
Conditional formatting can automatically highlight the top 10 percent or bottom five values in any range. Therefore, you never need to sort a table just to find outliers.
How to apply it:
Go to Conditional Formatting > Top/Bottom Rules > Top 10 Items or Top 10 Percent.
Adjust the number to suit your needs. This is particularly useful in sales rankings, student score analysis, and inventory turnover reports.
Use Case 10 – Building a Visual Gantt-Style Tracker
While a proper Gantt chart requires more setup, conditional formatting can simulate one inside a table. Consequently, project timelines become visible without external tools.
How to apply it:
Set column headers as dates. Use a custom formula to check if the date falls between a start and end date in each row:
=AND(D$1>=$B2,D$1<=$C2)
Cells that fall within the project duration get highlighted in your chosen color, creating a timeline bar effect across the row.
Use Case 11 – Highlighting Cells Based on Another Cell
Sometimes you want a cell to change color based on what another cell says. This creates dynamic, linked formatting across your spreadsheet.
How to apply it:
Use a formula referencing another cell. For example, highlight column A red if column B in the same row contains “No”:
=$B2=”No”
This is especially useful in checklists, approval workflows, and review processes.
Use Case 12 – Creating a Color-Coded Attendance or Schedule View
Last but not least, Conditional formatting in Excel works well for weekly or monthly grids where you want to show presence, absence, or activity type using colors.
How to apply it:
Use simple text-match rules. For example:
- “Present” triggers green
- “Absent” triggers red
- “Remote” triggers blue
You can stack multiple rules on the same range, each with its own condition and color. As a result, a plain grid becomes an intuitive visual calendar.
When Should You Call a Specialist?
Conditional formatting in Excel is a powerful tool, but it has its limits. As your spreadsheet grows in complexity, maintaining multiple nested rules, managing performance, and ensuring consistency across large data sets can become challenging without expert support.
That is where specialized Excel consulting makes the difference. Building custom spreadsheets with professional-grade structure and automation ensures your data works for you, not against you.
Source/Know More
For a deeper understanding of Excel’s conditional formatting capabilities and best practices, refer to Microsoft’s official documentation
Conclusion: Conditional Formatting in Excel Is Just the Beginning
Throughout this tutorial, you explored 12 use cases that show how conditional formatting in Excel goes far beyond simple cell highlights. From heatmaps and deadline trackers to full row formatting and Gantt-style views, this tool helps you turn raw numbers into clear, actionable visuals.
However, building truly efficient spreadsheets requires more than one feature. It requires a structured approach, clean data, and the right automation in the right places. Therefore, if your spreadsheets are becoming harder to maintain, or if your team needs a reliable solution, consider working with specialists who do this every day.
Sapphire Business Technology Brasil has helped more than 2,000 satisfied clients build smarter, faster, and more professional spreadsheets and reports. Whether you need to automate or build custom excel spreadsheets, or scale your entire data infrastructure, our team is ready to support your next step.
Content created by Sapphire Business Technology, based on over 2,000 satisfied clients and deep expertise in Excel, Power BI and others data solutions.