Key takeaways
- A reliable Excel P&L starts with structure, not numbers: separate data from presentation, keep category logic consistent and make every formula transparent.
- Use at least three tabs: Raw Data for inputs, a Mapping Table assigning categories to P&L lines, and a P&L Report driven entirely by SUMIFS formulas.
- Build the report top to bottom from revenue through COGS, gross profit, operating expenses and EBITDA to net profit, with every calculated line a formula, never a hard-coded number.
- Avoid whole-column SUM ranges, merged cells, manual + totals and working without dated backups; once you need multiple entities, multi-currency or live dashboards, consider specialists or Power BI.
Building a P&L in Excel
A Profit and Loss statement also called an Income Statement or P&L is one of the most important financial documents any business produces. (Investopedia’s guide to understanding the income statement)
It tells you clearly whether the company made money, where revenue came from, and what expenses consumed it. Building one in Excel seems straightforward at first. However, without a solid structure, your P&L quickly becomes a maintenance nightmare: broken formulas, misaligned categories, and data that does not reconcile month over month.
This tutorial walks you through how to build an Excel spreadsheet for P&L statement using the best practices professionals rely on. No advanced accounting degree required.
By the end, you will have a working structure and the knowledge to maintain it correctly.
Why Structure Matters Before You Type a Single Number
Many people open Excel, type “Revenue” in cell A1, and start filling in numbers. This approach works for a one-time report but fails completely once you need to update, compare, or share the file across months or departments.
A well-structured P&L workbook is built on three principles: separation of data from presentation, consistent category logic, and formula transparency. Moreover, it should be easy enough for someone unfamiliar with the file to understand without asking questions.
Before entering any numbers, plan your sheet architecture. Specifically, decide how many sheets you need, where raw data lives, and where the formatted output goes.
Recommended Sheet Architecture
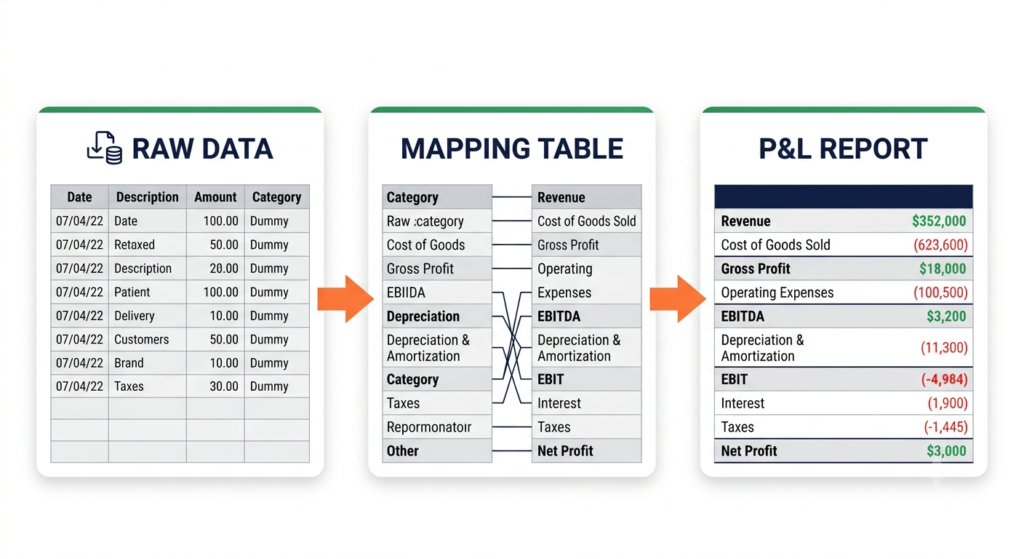
A clean P&L workbook typically uses at least three tabs:
- RAW DATA: Where you paste or import monthly transactions, revenue entries, or exported data from your accounting system. No formatting here. No formulas that change automatically. Just clean, consistent input.
- MAPPING TABLE: A reference list that assigns each raw category to a P&L line item. For example, “Software Subscriptions” maps to “Operating Expenses > Technology.” This table is the engine that makes your P&L flexible and easy to update without touching the main report.
- P&L REPORT: The final formatted output, driven entirely by SUMIF() or SUMIFS() formulas pulling from the Mapping Table logic while considering filters at the P&L report sheet. This sheet is what stakeholders see.
This architecture means that when a new expense category appears, you add one row to the Mapping Table and the entire P&L updates automatically. Consequently, no manual edits to the report itself are ever needed.
Building the P&L Structure: Line by Line
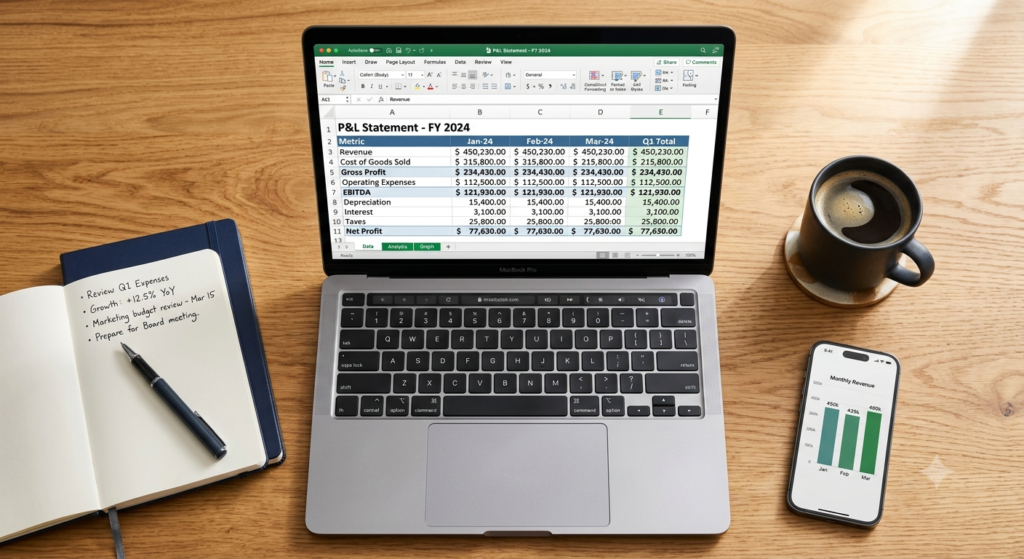
Once your architecture is set, build the P&L report tab with the following standard structure. Each section must flow logically from the one before it, because P&L statements are read top to bottom:
[REVENUE SECTION]
- Gross Revenue
- Sales Returns / Discounts
= Net Revenue
[COST OF GOODS SOLD — COGS]
- Direct Materials
- Direct Labor
- Other Direct Costs
= Total COGS
[GROSS PROFIT]
= Net Revenue minus Total COGS
[OPERATING EXPENSES — OPEX]
- Salaries and Benefits
- Rent and Utilities
- Marketing and Sales
- Technology and Software
- Administrative Expenses
= Total OPEX
[EBITDA]
= Gross Profit minus Total OPEX
[NON-OPERATING ITEMS]
- Interest Expense
- Taxes
= Net Profit (or Net Loss)
Each line that is calculated (marked with =) should use a formula referencing rows above, never a hard-coded number. This is non-negotiable for a maintainable P&L.
Formula Best Practices for a Reliable P&L
The formulas inside a P&L workbook need to be both accurate and auditable. Therefore, follow these rules:
First, use SUMIFS() to pull data from your Raw Data tab using criteria from the Mapping Table.
For example:
=SUMIFS(RawData[Amount], RawData[Category], MappingTable[P&L Line], RawData[Month], B1)
This approach means your P&L populates automatically when you update the raw data tab, and each formula clearly shows what it is calculating.
Second, never mix input values and calculated values in the same column. Hard-coded numbers should only appear in the Raw Data tab. Everything in the P&L Report tab should be a formula.
Third, use named ranges for your date headers (months) so that formulas remain readable even as the file grows. Additionally, color-code your cells: blue for input, black for formulas, and gray for locked reference cells.
Common Mistakes to Avoid
Even experienced Excel users fall into these traps when building a P&L from scratch:
Using SUM() on entire columns instead of defined ranges is a performance and accuracy risk. Instead, always define the exact range your data occupies.
Merging cells for formatting purposes, particularly in headers breaks formulas and makes sorting impossible. Use Center Across Selection (Format Cells > Alignment) as an alternative that achieves the same visual result.
Building the report without a version control system is another common mistake. Consequently, when something breaks three months later, there is no clean version to roll back to. Save dated backup copies at each major milestone.
Finally, avoid building totals by manually selecting individual cells with +. Use SUM() with a defined range so that new rows inserted within the range are automatically included.
When Your P&L Needs More Than Excel Can Offer
A well-built Excel P&L covers the needs of most small to medium-sized businesses. However, as the business grows multiple entities, multi-currency operations, integration with ERP data, or real-time dashboards, Excel alone starts showing its limits.
At that point, the right move is not to add more sheets. Rather, it is to bring in specialists who can build custom Excel spreadsheet for P&L and other subjects at a professional level, or integrate the P&L into a Power BI dashboard that pulls live data and eliminates manual updates entirely. Hiring specialists in Excel means getting a solution designed to scale alongside your business.
CONCLUSION
Building a P&L statement in Excel is absolutely achievable without being an accounting expert or a spreadsheet developer. The key is starting with the right architecture, keeping data and presentation separate, and using formulas that are transparent and maintainable.
Follow the structure in this tutorial and your P&L will be clean, fast to update, and easy for anyone in your organization to read. When the time comes to go beyond what a manual workbook can do, custom spreadsheets built by specialists will be the right next step.
Content produced by Sapphire Business Technology, based on expertise developed across more than 500 satisfied clients in Excel and data automation consulting.