Understanding Financial Modelling in Excel
Excel financial modelling is one of the most valuable skills in business and also one of the most commonly done wrong. Whether you are projecting revenue, running a scenario analysis, or evaluating an investment, a poorly structured model can lead to decisions built on broken logic and hidden errors.
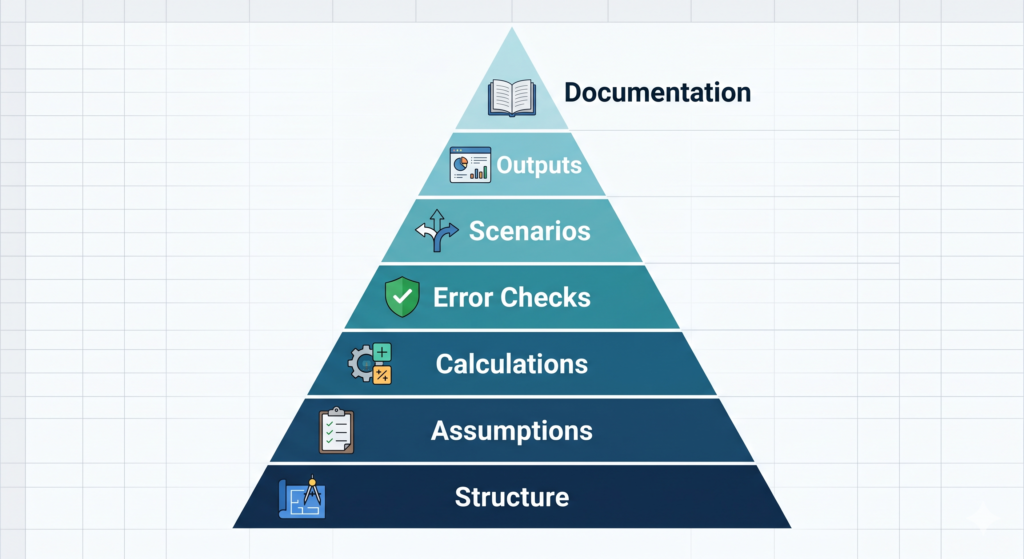
The truth is, most messy models do not fail because of complex formulas. They fail because the foundations were never set up correctly. This tutorial walks you through the seven building blocks that every clean, reliable financial model in Excel must have in order, with clear reasoning behind each one.
You do not need to be a finance expert to follow this guide. However, by the end, you will understand exactly how Excel financial modelling works at a structural level and what separates a model that holds up under pressure from one that falls apart during a board presentation.
Block 1: A Clear and Consistent Structure
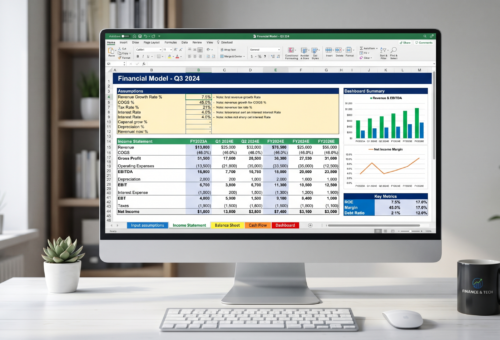
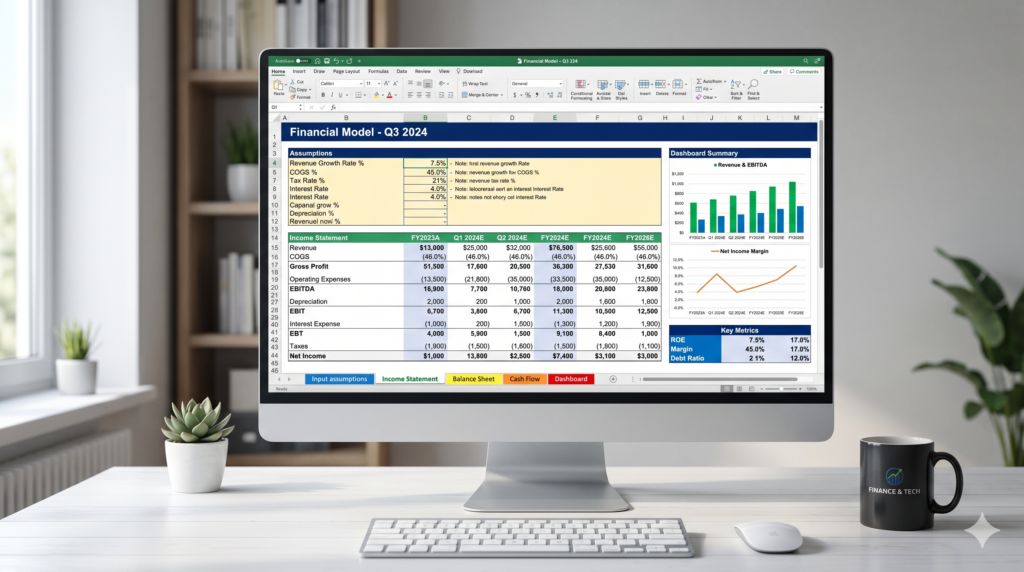
Before you type a single number, your model needs a logical structure. Think of this as the blueprint. Every professional Excel financial model separates three core areas: inputs (assumptions), calculations (engine), and outputs (results). These three layers should never be mixed on the same sheet or inside the same cell.
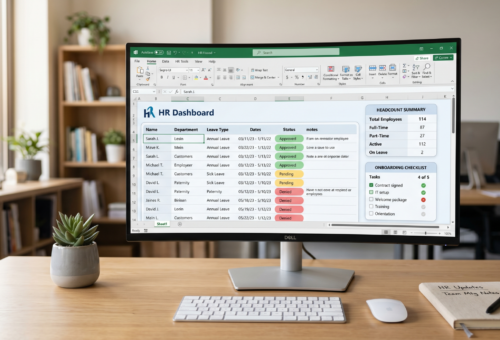
A practical way to implement this is through a tab system. Use one tab for assumptions, one or more for calculations (income statement, balance sheet, cash flow), and one for the final dashboard or output summary. Color-code your tabs so anyone opening the file can navigate it instantly.
This single habit eliminates the most common source of model errors. Formulas that reference hard-coded numbers buried inside calculations, invisible to anyone reviewing the work.
Block 2: A Dedicated Assumptions Sheet
When creating an Excel financial modelling, every number that drives your model should live in one place: the assumptions sheet. Revenue growth rate, cost of goods sold percentage, headcount, tax rate… All of these belong here, labelled clearly and never duplicated elsewhere in the model.
When a variable changes, you update it once. Consequently, every calculation that depends on it updates automatically. This is the core principle behind a maintainable model. Additionally, keeping assumptions visible makes it easy to run sensitivity analysis and scenario comparisons. You simply change the inputs and watch the outputs respond.
Furthermore, labeling each assumption with a unit (%, $, days, etc.) and a brief description adds clarity for collaborators and reduces questions during review.
Block 3: Reliable Calculation Logic
Once your assumptions are in place, your calculations should be driven entirely by references to those inputs never by manual entry. Each formula should be simple enough to read and trace. If a single formula requires scrolling across dozens of columns to understand, it needs to be broken into smaller steps.
One practical rule: build your model so that any formula can be audited in under 30 seconds. Use Excel’s “Trace Precedents” and “Trace Dependents” tools regularly during construction. Also, avoid merging cells in calculation areas, they usually break array formulas and make audits far more difficult.
For time-series models, structure your columns as time periods (months, quarters, years) and keep all formulas in a row consistent so they can be copied horizontally without manual adjustment.
Block 4: Error Checks Built Into the Model
Professional Excel financial modelling always includes internal checks. These are dedicated cells or rows that confirm whether key figures balance. For example, whether total assets equal total liabilities plus equity, or whether cash flows reconcile across periods.
A simple approach is to create a checks tab where each balance test produces either “OK” in green or “ERROR” in red using conditional formatting.
Before sharing any model, every check should display “OK.” This discipline prevents presenting a model with silent errors that only surface weeks later when a decision has already been made.
According to a study referenced by the Financial Modelling Institute, over 90% of large spreadsheets contain material errors, most of which are never caught before use.
Block 5: Scenario and Sensitivity Analysis
A model with only one set of outputs is a model that answers only one question. Scenario analysis allows you to define a base case, a best case, and a downside case, each driven by different assumption inputs.
Excel’s built-in tools for this include Data Tables (for two-variable sensitivity) and named ranges combined with an INDEX/MATCH or CHOOSE function to switch between scenario sets.
Furthermore, drop-down menus created with Data Validation make scenario switching clean and user-friendly, so stakeholders can test different realities without touching any formulas.
This block transforms your model from a static report into a decision-making tool. As a result, the people using it can explore tradeoffs rather than just reading a single projection.
Block 6: Outputs Designed for the Audience
Excel financial modelling has one mandatory phrase: The final outputs of your model are not for you, they are for the people who will make decisions based on them.
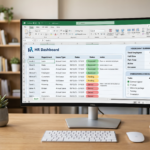
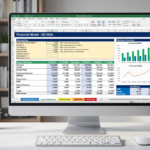
Therefore, output design matters. A well-structured summary sheet or dashboard presents key metrics clearly: revenue, EBITDA, net income, cash position, and growth rates displayed with charts and conditional formatting.
Avoid showing raw calculation sheets to non-financial stakeholders. Instead, build a clean output layer that summarizes what they need to see, with clear labels and consistent formatting. This also protects the model’s integrity by keeping non-users out of the calculation engine.
Use Excel charts linked directly to your outputs so they update automatically when assumptions change. Bar charts for comparisons, line charts for trends, and waterfall charts for variance analysis are the most common and effective choices in financial reporting contexts.
Block 7: Documentation and Version Control
The final building block is often skipped and it is the one that determines whether your model survives beyond its original author. Every Excel financial modelling should include a documentation tab that explains what the model does, what the key assumptions represent, who built it, and when it was last updated.
Beyond that, version control. Whether through Excel’s built-in version history in OneDrive/SharePoint or a simple naming convention like “Model_v1.2_2024-04” it prevents the classic scenario where no one knows which file is the current one.
A documented model is a trusted model. It can be handed off, reviewed, and improved without starting from scratch. This is what separates a personal tool from a business asset.
CITATION / SOURCE:
“Spreadsheet errors are endemic. They affect 88% of all spreadsheets, according to research from the University of Hawaii.”
- Source: Forbes — “How To Reduce Errors In Excel Spreadsheets”
Now you are ready to make a Excel financial model that truly works:
Clean Excel financial modelling is not about using the most advanced functions. It is about structure, discipline, and design. The seven building blocks covered here: Clear structure, a dedicated assumptions sheet, reliable calculation logic, internal error checks, scenario analysis, audience-focused outputs, and documentation.
These are the foundation of every model that holds up under real-world pressure.
Start with one block at a time. Even applying two or three of these principles to your next model will make a visible difference in quality and trustworthiness.
That said, financial models for business decisions carry real consequences. When accuracy and speed both matter, working with Excel specialists ensures your model is built right from the start and not rebuilt after a critical error.
At Sapphire Business Technology, our team of Excel specialists has supported more than 2,000 clients in building custom spreadsheets and financial models that are clean, auditable, and built to last.
If you are ready to take your modelling to the next level, we are here to help.
Content created by Sapphire Business Technology with over 2,000 satisfied clients through Excel, Power BI other Microsoft 365 softwares.