INTRODUCTION
If you spend hours every week copying data from different files, cleaning up messy spreadsheets, or reformatting reports before you can actually use the information, you already need Power Query.
The good news is you do not need to be a programmer to use it.
Power Query is a built-in tool in Microsoft Excel and Power BI that lets you connect, clean, and shape data automatically. You record the steps once, and the tool repeats them every time your data refreshes. Think of it as a reliable assistant that handles the boring, repetitive part of your data work.
In this tutorial, you will learn what it actually is, how it works in plain language, and, most importantly, when it makes sense to start using it in your daily routine.
What is Power Query?
It is a data transformation tool. It sits between your raw data source (a file, a database, a web page, or another spreadsheet) and the final table you want to analyse or report on.
Instead of manually editing data every time, you build a series of steps inside its screen. Each step does one job: remove blank rows, rename a column, change a date format, filter out irrelevant records, and so on. Together, these steps form a query.
Once your query is ready, you click Refresh. It re-runs every step automatically and delivers a clean, up-to-date table in seconds. Furthermore, your original data source is never touched or modified, which keeps your work safe.
For beginners, the biggest advantage is this: you do not write formulas or code. You use simple menus and buttons, and Power Query records the logic in the background.
Where Do You Find Power Query?
Power Query is already installed if you use Excel 2016 or newer. You access it through the “Data” tab on the Excel ribbon, under the “Get and Transform Data” section.
In Excel 2010 and 2013, Power Query was available as a free add-in from Microsoft. In those versions, it appears as a separate tab after installation.
Additionally, Power Query is a core component of Power BI Desktop, where it runs every time you load or refresh your data model. If you are already using Power BI, you are likely using Power Query without realizing it.
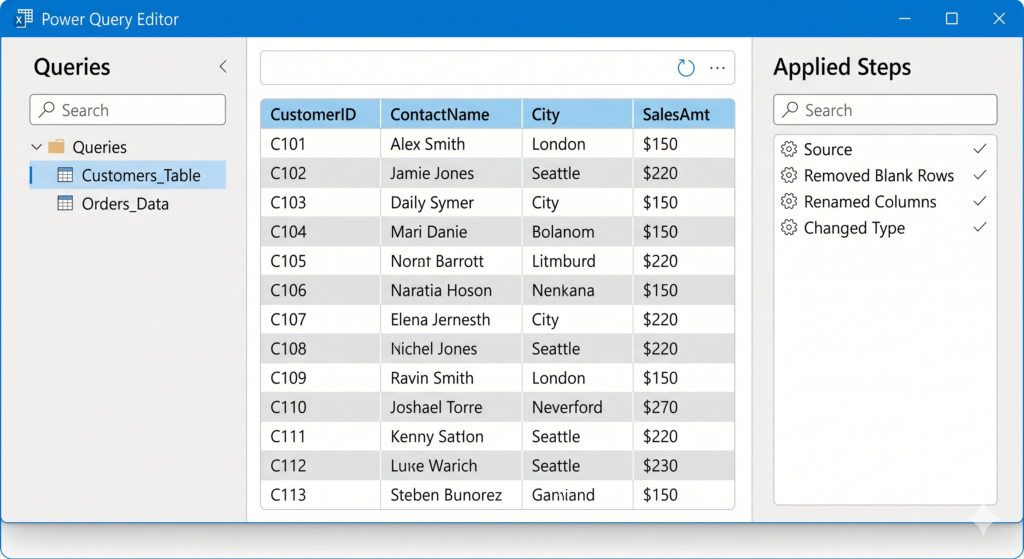
To open the editor, click “Get Data,” choose your data source, and then select “Transform Data.” This opens the Power Query Editor, where you will find all the transformation tools.
When Should You Start Using Power Query?
This is the most practical question. Not every data task needs Power Query, but certain situations are a strong signal that it is time to start.
Consider using Power Query when you find yourself doing the same data cleanup steps more than once a week. For example, if every Monday you download a sales report, delete certain columns, fix date formats, and paste the result into another sheet, that entire process can be automated with a single query.
Also, think about using it when you combine data from multiple files or sources. Power Query can merge tables, append rows from different files, and match records across sources in a way that would take hours to do manually.
Consequently, monthly or quarterly reports that used to take a full day can often be reduced to a few minutes.
Another good indicator is when your raw data is inconsistent. Suppliers and systems rarely send data in a clean format and Power Query includes tools to handle extra spaces, inconsistent capitalization, wrong data types, and missing values without you changing the original file.
On the other hand, if your data is already clean, small, and only used once, a standard Excel formula may be all you need.
A Simple Real-World Example for Beginners
Imagine your company receives a weekly CSV file from a sales platform. The file has 15 columns, but you only need 5. The dates are formatted as text, the product names have inconsistent spacing, and there are always a few completely blank rows.
Without Power Query, you lose hour fixing all of this manually every single week but with Power Query, you set it up once: remove the unwanted columns, fix the date format, trim the spacing, filter out blank rows.
Next week, you drop the new CSV into the same folder and click Refresh. The clean table updates in seconds.
This example captures exactly the kind of challenge Power Query solves. It does not require any technical expertise to build. It saves time, reduces errors, and makes your work more reliable. Therefore, it is one of the most practical tools available to anyone who works with data regularly.
Source
According to Microsoft’s official documentation, Power Query “provides a powerful data import experience that encompasses many features.” It is designed to let users connect to data, transform it, and load it into tools like Excel and Power BI with no coding required.
Source: Microsoft Learn – Power Query documentation
Is Power Query Enough, or Do You Need Professional Help?
For straightforward, repetitive tasks, Power Query is a fantastic self-service tool. However, as your data complexity grows, so do the limitations.
Many businesses reach a point where their queries become slow, their data sources multiply, or they need Power Query connected to a proper Power BI dashboard to support the entire team. At that stage, having an expert set up the right architecture from the beginning saves significant time and avoids costly rework.
Furthermore, combining Power Query with a well-designed Power BI solution can turn your raw operational data into a real-time strategic asset, not just a clean table.
Conclusion
Power Query is one of the most practical tools you can learn if you regularly work with data in Excel or Power BI. It is beginner-friendly, already installed, and can save hours every week once you understand the basics.
Start small: pick one repetitive task you do weekly, record the steps in Power Query, and watch the time savings add up. As your confidence grows, you will find more and more opportunities to automate and improve your data workflows.
When your needs go beyond self-service automation, the team of Excel Specialists at Sapphire Business Technology is ready to help.
With more than 2,000 satisfied clients, Sapphire’s specialists in Excel, Power BI and Power Platform can design, build, and optimize the data solutions your business needs to move faster and decide smarter.
Content created by Sapphire Business Technology, based on their expertise working with more than 2,000 satisfied clients in Excel, Power BI and Microsoft 365 Solutions.