
Key takeaways
- A wealth advisory firm moved client portfolio management out of loose spreadsheets and into a Power Apps platform backed by Dataverse.
- Advisors can set up layered investor profiles, test “New Money” splits and compare suggested and current holdings bank by bank.
- Sapphire Business Technology delivered the MVP in six business days, with Power Automate flows and a Power BI client report.
- The firm estimates it saves 25 to 35 hours per week across setup and daily work.

Client portfolio management is the process of setting investor profiles, splitting new money across assets and comparing the suggested plan with what the client already holds at each bank, with a dated record for compliance.
Most advisory firms have a sound investment method. The trouble starts when that method lives in spreadsheets that each advisor has quietly changed. In this case study, we show how we rebuilt client portfolio management for a wealth advisory firm with Power Apps, Dataverse, Power Automate and Power BI. We also show how you can set up the same process in your own firm.
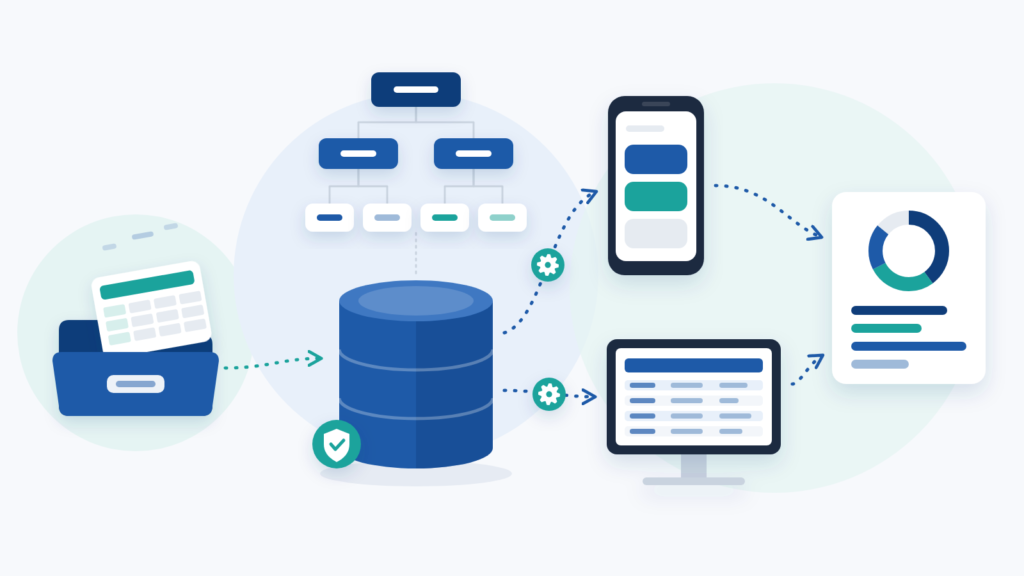
The platform lets advisors build investor profiles and test how new money should be split. They can then compare that plan with what clients already hold at each bank. Finally, they share a branded Power BI report. We delivered the MVP in six business days.
In this article
- Project snapshot
- The problem: client portfolio management trapped in spreadsheets
- What the advisory firm needed
- Building the investor profile engine in Dataverse
- New Money simulation and portfolio comparison
- Guardrails for client portfolio management: security, flows and reports
- Results: an MVP in six business days
- How to structure client portfolio management: step by step
- The lesson: design the categories before the screens
- Need client portfolio management built for you?
Project snapshot
| Item | Detail |
|---|---|
| Industry | Financial advisory and wealth management |
| Solution | Portfolio planning platform: investor profiles, “New Money” simulation, portfolio comparison and client report |
| Tools | Power Apps (model-driven + canvas), Dataverse, Power Automate, Power BI, Excel (import), OneDrive/SharePoint |
| Timeline | 6 business days (MVP) |
| Departments | Advisory, Compliance, Back Office, Sales |
| Impact | Estimated 25 to 35 hours saved per week (setup + ongoing operations) |
The problem: client portfolio management trapped in spreadsheets
Our client is a wealth advisory practice that serves private and corporate investors. It had a good method for splitting money across assets. However, that method lived in the heads of its senior advisors and in a folder of spreadsheets. Each advisor had tweaked their own copy over the years.
When a new client arrived with money to invest, an advisor copied an old file. They typed over the numbers and changed the percentages by hand. If the client already held assets at other banks, someone keyed those in line by line before any comparison could start. Nothing was reusable, and nothing left a clear trail.
The costs added up. Two advisors could give two different plans for the same type of investor, because their files had drifted apart. Back office staff spent hours matching position data that came in as PDF statements or exported sheets. Meanwhile, Compliance could not easily answer a basic question: on what date, and under which profile, did we make this plan?
Are your advisors still copying old files to build each new plan? Tell us how your firm sets up investor profiles today and our specialists will suggest where to start.
What the advisory firm needed
Before we built anything, we ran a scoping session. Together, we turned the wish list into four clear needs.
- Flexible investor profiles. The firm’s method changes over time, so staff had to add new categories without calling a developer.
- “New Money” simulation. Given a profile and an amount of money, the platform should return a full suggested portfolio with no manual sums.
- Comparison. Advisors needed to record what a client holds at each bank, add it all up, and compare it with the suggested plan.
- A client-ready report. The output had to be something an advisor could send, with the firm’s logo and colours.
Two more rules sat underneath. First, the platform had to control who sees what, because portfolio data is sensitive. It also had to arrive fast, so we agreed on an MVP in six business days.
Building the investor profile engine in Dataverse
The heart of the system is a three-layer way to sort investments. Most of our design effort went here.
- Layer one splits investments into fixed income and variable income.
- Layer two covers the type of return, such as fixed-rate, floating-rate or inflation-linked, and links each type to layer one.
- Layer three holds the type of issuer, such as private or government.
Every list stays open. The firm adds new return types and issuer types through the app whenever its method needs them. Dataverse enforces the link between layers, so an advisor building a variable income profile never sees return types that belong only to fixed income. In other words, staff cannot enter a combination that makes no sense.
A profile sits on top of these layers. It is a named set of target percentages with a version number, and it must total 100 percent. The app checks this as the advisor types. Advisors can also copy a profile, adjust it and save it under a new name. That one feature ended the old habit of copying spreadsheet files, which was the root cause of advisors drifting apart.
We built all of this in Dataverse rather than in worksheet cells. Links between tables, checks and permissions belong in the data layer. That way, every app, flow and report picks them up for free.
New Money simulation and portfolio comparison
“New Money” is the feature advisors asked for first, and it is simple to use. The advisor picks a client, chooses the right profile and enters the money available. The platform then returns the full suggested portfolio across all three layers, in cash terms and in percentages.
The app saves each run with the date and time, the profile version and the advisor’s name. Compliance asked for exactly this. It also costs nothing to capture at the moment of creation.
The comparison module turned a calculator into a platform. Advisors record what a client holds at each bank, and the platform sorts each holding into the same three layers. It then shows three views: the full combined position, the plan against each bank, and the plan against the combined total. That last view drives the talk about what to rebalance.
We also kept Excel in the loop. The back office already got position data as spreadsheets, so we built a simple Excel import template linked through OneDrive and SharePoint. Staff drop a file into a watched folder, and the clean rows land in Dataverse. Staff can still type in one-off fixes by hand.
Guardrails for client portfolio management: security, flows and reports
The platform uses both types of Power Apps. The model-driven app handles the admin side: clients, profiles, lists, holdings and banks. Meanwhile, the canvas app gives advisors a clean screen for running plans in client meetings.
Access follows Dataverse security roles, so each team sees only what it needs. We keep each version of a profile instead of overwriting it. As a result, a plan made in March can still be explained in November.
Power Automate does the quiet work. When a position file lands in the watched SharePoint folder, a flow checks it, loads the clean rows and emails the sender a list of anything it rejected. When an advisor marks a plan as ready to share, another flow builds the client report and files it in the right client folder. A scheduled flow also alerts advisors when a client’s real mix drifts too far from the target profile.
The Power BI report reads straight from Dataverse. It opens with the combined position and shows the suggested mix beside the current one, layer by layer. Next, it breaks holdings down by bank. It ends with a plain-English summary of the suggested moves.
Results: an MVP in six business days
The MVP went live in six business days. We hit that date because we agreed the scope before the build, designed the data model once, and reused what Dataverse and Power Apps offer out of the box.
The firm estimates its new client portfolio management platform saves 25 to 35 hours per week across setup and daily work. Just as important, advice became consistent across advisors, because everyone now uses the same profile list. Compliance gained a dated audit trail with no extra manual step. Back office staff also stopped retyping holdings and now focus on exceptions.
To finish, we recorded a video walkthrough of the main functions, entry points and common mistakes, and added a written user guide.
Sapphire Business Technology rebuilt client portfolio management for a wealth advisory firm on Power Apps and Dataverse in six business days, and the firm estimates it now saves 25 to 35 hours a week.
How to structure client portfolio management: step by step
You can use the same thinking before you pick any tool. These steps follow the order we used.
- Write down your category tree. List your asset types in layers, for example income type, then return type, then issuer type. Keep each list open so you can add values later.
- Set each investor profile as target percentages. Every profile must add up to exactly 100 percent. Give each one a name and a version number.
- Keep one master list. Store the tree and the profiles in one place that every advisor reads from, not in personal copies.
- Record current holdings in the same layers. Sort every asset a client holds, bank by bank, into the same layers as your profiles.
- Compare in three ways. Look at the combined total, the plan against each bank, and the plan against the total. The last one tells you what to rebalance.
- Save every plan with its date, profile version and advisor. That record becomes your audit trail.
- Pick the right platform for your size. If one or two advisors run a handful of portfolios, a tidy Excel workbook with protected sheets may be enough. If you have several advisors, compliance reviews and sensitive client data, move to a platform like Dataverse with role-based access and automatic imports.
- Plan the handover. Before anyone else uses the tool, record a short video on how to enter data, refresh results and avoid common mistakes.
The lesson: design the categories before the screens
Good client portfolio management starts with the categories, not the screens. In this project, the three-layer structure was the real deliverable. Every screen, flow and report took its logic from it, and that is a big part of why the build fitted into six business days. Teams that start with screens usually end up rebuilding them.
Security works the same way. Microsoft’s guide to security roles and privileges in Dataverse explains that one user can hold several roles, and that their rights add up. Our advice goes one step further. Because rights add up, start every role with the least access that still works, then add rights with care. If you copy a powerful role and try to strip rights away later, that is where mistakes hide.
Finally, keep the tools people already trust. Excel was not the enemy here. It became the easy way in for position data. As a result, the back office took up the platform without giving up a tool that worked.
Need client portfolio management built for you?
The steps above give any advisory firm a clearer structure, even on paper. However, turning that structure into a secure app with automatic imports, audit trails and client-ready reports takes specialist work. That is the part a professional team can shorten.
We design Power Apps, Dataverse and Power BI solutions around the way your advisors already work. If you would rather go straight to a working platform, see how our Power Platform service can support client portfolio management in your firm.
Want one shared profile list, dated plans and client-ready reports? Send us a short description of your advisory process and the teams involved.
Frequently asked questions
What is client portfolio management?
How long did the project take?
What is the New Money simulation?
What results did the firm see?
Is Excel still part of the process?
This case study was written by Sapphire Business Technology, drawing on its experience with 500+ clients and 2,000+ projects in Excel, Power BI and Power Platform.