
Key takeaways
- You can build a working sales pipeline tracker in Excel from scratch by first defining deal stages, such as Prospecting, Qualified Lead, Proposal Sent, Negotiation and Closed Won or Lost.
- Data Validation dropdowns on the Stage and Owner columns keep entries consistent, so variations like “Negotiating” versus “Negotiation” no longer break your filters.
- A Weighted Value column (=C2*E2/100) multiplies deal value by probability, giving a more realistic revenue forecast that recalculates automatically as deals progress.
- Colour-code stages using three to four conditional formatting shades, then add a Dashboard tab with SUMIF totals per stage and a bar chart for weekly team reviews.
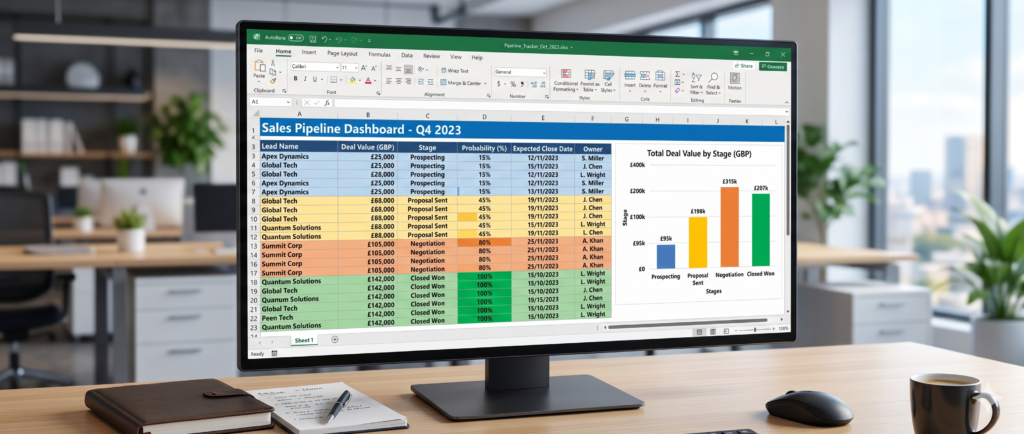
A sales pipeline tracker in Excel is a custom spreadsheet that records each deal’s stage, value, probability, expected close date and owner, keeping follow-ups visible and giving you a weighted forecast that recalculates automatically.
A well-managed sales pipeline is the backbone of any growing business. Without a clear view of where every deal stands, it is easy to lose track of follow-ups, miss close dates, or misread your revenue forecast. The solution does not have to be expensive. In this tutorial, you will learn how to build a custom Excel spreadsheet that works as a fully functional sales pipeline tracker, even if you are starting from scratch and have no technical background.
In this article
Setting Up Your Pipeline Stages
Before building anything, you need to define the stages your deals move through. Common stages in B2B sales include Prospecting, Qualified Lead, Proposal Sent, Negotiation, and Closed Won or Lost. Furthermore, to understand what a healthy sales pipeline looks like, see here. It helps to map stages to your actual sales process, not a generic template.
To create your stage list in Excel:
- Open a new workbook and name the first tab “Pipeline.”
- In row 1, add your column headers: Lead Name, Company, Deal Value, Stage, Probability (%), Expected Close Date, and Owner.
- On a second tab named “Lists,” type all your stage names in column A. This will power a dropdown later.

Adding Dropdown Menus for Consistency
One of the most common challenges in shared spreadsheets is inconsistent data entry. For example, one team member types “Negotiating” while another writes “Negotiation” and suddenly your filters break. However, data validation solves this problem completely.
learn below how to add a dropdown menu for the stage column:
- Select all cells in the Stage column (below the header).
- Go to the Data tab and click “Data Validation.”
- Under “Allow,” choose “List.”
- In the Source field, reference the stage names you typed on your Lists tab separated by a comma (“,”).
- Click OK. Then every cell in that column now shows a dropdown with your approved stage names.
In addition, repeat this process for the Owner column if your team has a fixed list of sales reps.
Calculating Weighted Pipeline Value
A pipeline tracker becomes truly powerful when it tells you not just the deal value, but the expected revenue. Therefore, multiplying deal value by probability gives you a weighted forecast that reflects reality more accurately.
In a new column called “Weighted Value,” enter this formula in the first data row:
=C2*E2/100
Where C2 is Deal Value and E2 is Probability (%). Consequently, as your team updates deal stages and probabilities, the weighted value recalculates automatically. This single column can transform how your leadership team reads the forecast.
Keeping deal values and probabilities consistent gets harder as more people edit the tracker. Our Excel specialists can build a pipeline tracker around your own sales stages.
Applying Conditional Formatting by Stage
Visual cues make data easier to scan quickly. As a result, adding color-coding to your stage column allows anyone to read pipeline health at a glance without digging into filters.
To apply conditional formatting:
- Select the Stage column.
- Go to Home > Conditional Formatting > Highlight Cell Rules > Equal To.
- Set rules for each stage – for instance, “Closed Won” in green and “Prospecting” in blue.
- Repeat for each stage with a distinct color.
On the other hand, avoid using too many colors. Three to four distinct shades are enough to keep the sheet readable.
Building a Summary Dashboard
Finally, a one-page summary view makes your tracker genuinely useful for weekly team reviews. To do this, add a new tab named “Dashboard” and use SUMIF formulas to pull totals by stage:
=SUMIF(Pipeline!D:D,”Proposal Sent”,Pipeline!C:C)
This formula sums all deal values in the Pipeline tab where the Stage equals “Proposal Sent.” In summary, by replicating this formula for each stage, you create a live summary that updates every time your team edits the main tracker.
Additionally, insert a simple bar chart from your summary table to give leadership a visual snapshot in seconds.
| Step | What you set up | Why it matters |
|---|---|---|
| 1. Pipeline stages | Stage names on a Lists tab and column headers on a Pipeline tab | Maps the tracker to your actual sales process |
| 2. Dropdown menus | Data Validation lists on the Stage and Owner columns | Stops inconsistent entries from breaking your filters |
| 3. Weighted value | A Weighted Value column with =C2*E2/100 | A forecast that recalculates as deals progress |
| 4. Conditional formatting | Three to four distinct colours by stage | Pipeline health can be read at a glance |
| 5. Summary dashboard | SUMIF totals per stage and a bar chart on a Dashboard tab | A one-page view for weekly team reviews |
When should your sales pipeline tracker be built for you?
You now have the foundation to build a custom Excel spreadsheet that tracks your entire sales pipeline. However, as your team grows and data becomes more complex, a manually maintained spreadsheet can reach its limits, especially when multiple users edit it simultaneously or when you need automation rules and advanced reporting.
At Sapphire Business Technology, our specialists in Excel solutions have built multiple types of custom pipeline trackers, reporting dashboards, and fully automated spreadsheet systems for more than 500 satisfied clients the needs a custom Excel spreadsheet. We do not deliver generic templates, we build solutions that fit exactly how your sales process works and at the same time saving your team hours every week.
Get in touch with Sapphire Business Technology and find out what a truly custom Excel spreadsheet solution looks like for your business.
Has your pipeline spreadsheet outgrown manual updates and shared editing? Tell us how your sales process works and we can design the tracker around it.
Frequently asked questions
What is a sales pipeline tracker in Excel?
Which stages should a sales pipeline have?
How do I calculate weighted pipeline value in Excel?
How do dropdown menus keep pipeline data consistent?
How do I build a summary dashboard for the pipeline?
Content created by Sapphire Business Technology – specialists in Excel, Power BI and Microsoft 365 solutions with over 500 satisfied clients.