
Key takeaways
- A healthcare clinic replaced department-by-department Excel reporting with a single Power BI clinic dashboard, built in 2 business days.
- We kept the clinic’s existing Excel data, then cleaned and restructured it into a Power BI data model with DAX measures on top.
- Administration, Finance and Operations now read the same figures, each through a view designed for its own decisions.
- We estimate the clinic saves more than 12 hours a month that used to go into compiling and cross-checking spreadsheets.

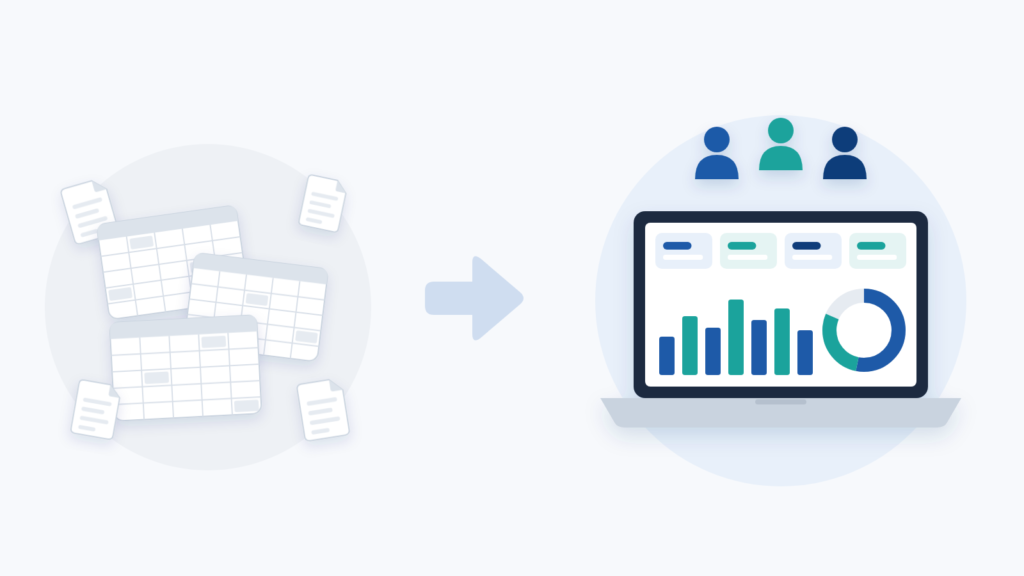
A Power BI clinic dashboard brings a clinic’s administrative, financial and operational data into one shared view, so Administration, Finance and Operations read the same figures, each through a view designed for its own decisions.
Running a clinic means juggling appointments, staff, billing and financial reporting at once, usually across spreadsheets that were never designed to talk to each other. That was the situation when a healthcare and clinic management client asked us for a Power BI clinic dashboard. The clinic already collected plenty of useful data. The trouble was that it sat in scattered files, and turning it into answers was slow.
This case study explains what we built and how we did it in two business days. It then shows how to plan the same kind of dashboard for your own clinic.
In this article
- Project snapshot
- The problem: data everywhere, insight nowhere
- How we built the Power BI clinic dashboard
- The result: one source of truth and 12+ hours back each month
- How to plan a Power BI clinic dashboard: step by step
- Why the data model matters more than the visuals
- Need a Power BI clinic dashboard without building it yourself?
Project snapshot
| Item | Detail |
|---|---|
| Industry | Healthcare and clinic management |
| Solution | Power BI management dashboard built from the clinic’s existing Excel data |
| Tools | Power BI, DAX, data modelling, dashboard design |
| Timeline | 2 business days |
| Departments | Administration, Finance, Operations |
| Impact | 12+ hours saved per month (estimated); one shared view of operations, financial indicators and team performance |
The problem: data everywhere, insight nowhere
Before the project, the clinic’s administrative, financial and operational data lived in separate Excel spreadsheets. Each department kept its own files, and none of them updated automatically. As a result, every team had its own version of the truth.
A simple monthly report meant pulling numbers from several files and cross-checking them by hand. Then someone had to hope nothing had changed since the last export. That routine cost hours every month, and it still left room for error.
This pattern is common in clinics of almost any size. Appointments, billing and staff work create new data every day. Without a central structure, however, that data rarely becomes information leaders can act on. Managers end up reacting to a staffing gap or a billing delay days or weeks after it starts.
The brief was clear. The clinic wanted to keep its Excel-based data and turn it into a professional dashboard that was easy to navigate. Management, Finance and Operations would all rely on it for day-to-day decisions.
Still pulling numbers from several files for every monthly report? Tell us which spreadsheets your clinic relies on and our specialists will suggest how to bring them together.
How we built the Power BI clinic dashboard
We started with the data, not the visuals. Rather than throwing away the clinic’s existing spreadsheets, we cleaned, organised and restructured them so they could feed a proper Power BI data model. This step matters more than it seems. Clinic spreadsheets tend to grow over time without a plan, and a dashboard is only as reliable as the model underneath it.
Next, we built the analytical layer in DAX (Data Analysis Expressions), the formula language behind Power BI calculations. This is where raw numbers become metrics. For example, financial and team indicators now calculate themselves as the data changes, instead of someone typing them in by hand.
Then came the design. Three audiences use the dashboard, so each gets a view built around what it needs to see. Clear visual hierarchy, simple filters and drill-down let a clinic director read a high-level financial summary in seconds. Meanwhile, an operations manager can click deeper into staffing or resource use for their own team.
Throughout, we followed one rule: a dashboard should answer the questions leaders already ask, not display whatever data happens to exist. In a clinic, that meant focusing on financial health, resource allocation and team performance. We designed the visuals around those priorities rather than around the layout of the source files.
The whole build, from data modelling to a presentation-ready dashboard, took 2 business days. That speed was possible because we pinned down the business questions early and fixed the data structure first.
The result: one source of truth and 12+ hours back each month
The finished Power BI clinic dashboard gave the clinic something it did not have before. It now has one view of its operations, financial indicators and team performance, all drawn from the same data model. Each department uses it differently:
- Administration tracks day-to-day operational indicators without waiting for a manual report.
- Finance sees revenue, costs and performance trends without reconciling numbers across spreadsheets.
- Operations monitors staffing and resource use with the same figures as everyone else.
That consistency is arguably the biggest shift. When every department reads from one source, arguments about whose numbers are right fade away. Instead, meetings move straight to what the numbers mean and what to do next.
Based on the manual reporting the dashboard replaced, we estimate the clinic saves more than 12 hours a month. Over a year, that adds up to at least 144 hours that administrative and finance staff can spend on higher-value work. Faster, better-informed decisions are the other gain, even if they are harder to count.
A Power BI clinic dashboard built by Sapphire Business Technology in 2 business days turned one clinic’s scattered Excel files into a single view of finance, operations and team performance, saving an estimated 12+ hours of reporting a month.
How to plan a Power BI clinic dashboard: step by step
You do not need to be a data specialist to prepare for a project like this. The steps below follow the same logic we used for this clinic.
- Write down the three to five decisions your managers make every week or month, such as approving overtime or reviewing costs. Each decision should map to at least one indicator on the dashboard.
- List every spreadsheet that feeds your monthly report today, who owns it and how often it changes.
- Check each file for consistency: the same column names, one type of data per column and dates stored as dates. If a sheet mixes notes, totals and raw rows, move the raw rows into a clean table first; if it is already a tidy table, you can connect it as it is.
- Where a sheet holds patient names or other personal details, leave those columns out. A management dashboard needs counts and totals, not identities.
- Connect the clean tables to Power BI Desktop and link them through shared fields such as date, department or staff member.
- Create your key measures in DAX. Start with simple totals, then add comparisons such as month on month.
- Build one summary page for leaders, then one page per department. Add filters and drill-down so each person can go from the headline figure to the detail behind it.
- Show the draft to one person from each department. If they cannot find their main number within a few seconds, simplify the page before adding anything new.
Why the data model matters more than the visuals
Clinics do not need to be large hospital groups to benefit from a project like this. Any healthcare business that runs billing, staffing or several departments through spreadsheets is a strong candidate. The challenge is rarely a lack of data. Rather, it is turning scattered files into a structure that answers questions on demand.
Microsoft’s guidance on star schema design for Power BI explains why structure comes first. It recommends splitting a model into dimension tables, which filter and group data, and fact tables, which hold the numbers you summarise. That is the technical reason we spent the first part of this project on the spreadsheets rather than on charts.
Our own addition is practical. In our view, the hardest part of a Power BI clinic dashboard is agreeing on definitions, not building tables. For instance, if Finance and Operations count “active staff” differently, no model can reconcile the two. Settle those definitions before anyone opens Power BI, and the build becomes the quick part of the project, as it was here.
Need a Power BI clinic dashboard without building it yourself?
The steps above will take a small clinic a long way. However, when data comes from several systems or the indicators depend on complex rules, a specialist team usually saves weeks of trial and error. It also helps to work with people who understand how clinic administration really runs.
If you would rather go straight to the result, our Power BI specialists can build a Power BI clinic dashboard around your existing spreadsheets. See our Power BI dashboard services to start the conversation.
Want one view of your clinic’s finance, operations and team performance? Send us a short description of the decisions your managers make each month.
Frequently asked questions
What is a Power BI clinic dashboard?
How long did the project take?
What results did the clinic see?
Should patient details go into the dashboard?
Why does the data model matter more than the visuals?
This case study was written by Sapphire Business Technology, drawing on its experience with 500+ clients and 2,000+ projects in Excel and Power BI.