
Key takeaways
- The stores of two apparel brands kept payroll, attendance and sales data in separate files that never connected.
- Sapphire Business Technology unified those sources into one retail KPI dashboard in Excel 365, built with Power Query and VBA.
- The dashboard tracks revenue, labour cost as a percentage of revenue and foot traffic for any store and any date range, and compares the two brands side by side.
- The solution saves more than 50 hours of manual work every month across Finance, HR and Operations.

A retail KPI dashboard brings revenue, foot traffic and labour cost into one view for any store and date range, so managers read ratios such as labour cost as a percentage of revenue instead of separate totals.
Two apparel retail brands, each with its own store portfolio, needed one view of how their stores performed, both financially and operationally. The numbers existed, but they sat in payroll, attendance and sales files that never met. This case study explains how we turned those files into a single retail KPI dashboard in Excel, and how you can apply the same approach to your own stores.
The result was one analytical model that tracks revenue, foot traffic and workforce cost efficiency, with more than 50 hours of manual work recovered each month. Better still, we built it so the same data model can move into Power BI later.
In this article
- Project snapshot
- The problem: three data sources that never talked to each other
- What the client asked for, and what the retail KPI dashboard needed
- Building the data model in Excel 365, Power Query and VBA
- How managers use the retail KPI dashboard
- Phase two: turnover and absenteeism without a rebuild
- Results: more than 50 hours back every month
- How to build a retail KPI dashboard in Excel: step by step
- The lesson: design around ratios, not totals
- Need a retail KPI dashboard built for you?
Project snapshot
| Item | Detail |
|---|---|
| Industry | Retail and apparel |
| Solution | Integrated Operational and Financial Performance Analysis System |
| Tools | Excel 365 + VBA + Power Query (Power BI-ready) |
| Timeline | Initial build, then a later phase adding turnover and absenteeism |
| Departments | Finance, HR, Operations, Executive Management |
| Impact | 50+ hours of manual work saved per month |
The problem: three data sources that never talked to each other
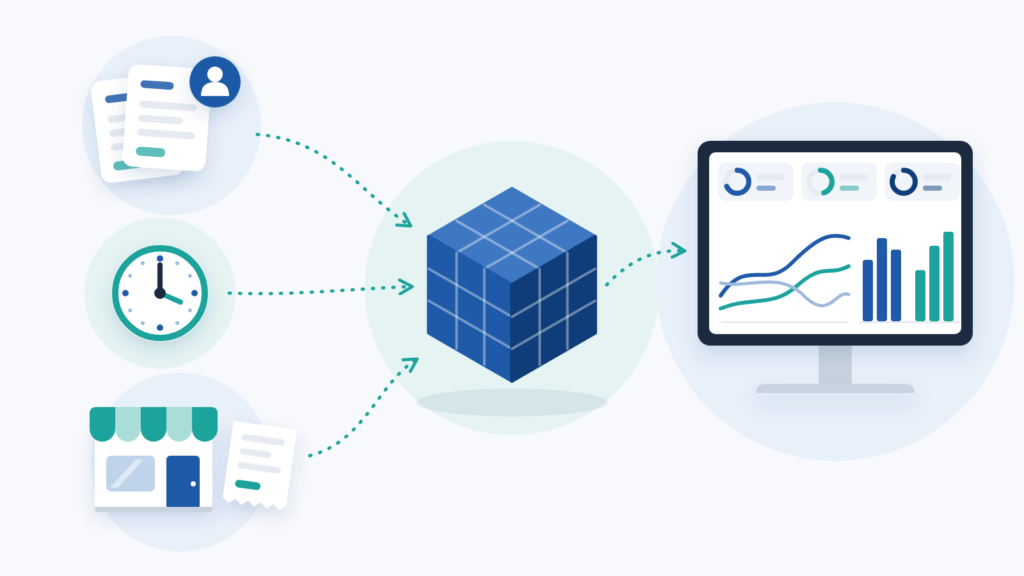
Payroll held every active employee, with their role, their store and their total monthly cost. The time-and-attendance platform exported a daily summary per employee showing who worked, when and for how long. Finally, each store kept its own sales spreadsheet with daily revenue and daily foot traffic side by side.
Each file made sense on its own. Together, they answered almost nothing. For example, nobody could say which store spent the highest share of its revenue on labour last week without opening several workbooks and building the comparison by hand.
The two brands made it harder still. Because the two brands ran separate store portfolios, the same exercise had to happen twice before any executive comparison was possible. Worse, it was recurring: someone rebuilt the same tables from scratch at every close.
Rebuilding the same store tables at every close? Tell us where your payroll, attendance and sales data come from and our specialists will suggest how to connect them.
What the client asked for, and what the retail KPI dashboard needed
The written request listed three outputs. These were revenue per store, foot traffic per store, and employee cost across different periods such as day, week and month.
We treated that list as a starting point, not a specification. Once we mapped the source files, a fourth need became clear: revenue and labour cost only mean something together. A store with strong sales can still be a weak store if payroll eats a large share of that revenue. Similarly, foot traffic without revenue says nothing about conversion, and headcount without traffic says nothing about whether a shift was over or understaffed.
So we designed around ratios, not just totals. That is why the final dashboard leads with labour cost as a percentage of revenue rather than a raw payroll figure.
One more constraint mattered. Retail does not run in calendar months. Promotions start mid-month, and a regional manager comparing two campaign windows needs to filter by the exact dates each campaign ran. Every part of the model therefore had to accept open date ranges, not fixed periods.
Building the data model in Excel 365, Power Query and VBA
We started at the foundation, not the dashboard. Clients rarely see this layer, yet it decides whether a tool survives its first year.
First, we created a structural layer with the fixed attributes of each store: name, category, size band, annual revenue reference and authorised headcount positions. This layer works as a dictionary. As a result, each store is defined once and referenced everywhere.
Next came three import destinations, each built to receive one source without manual editing. One tab takes the attendance export, one takes payroll and headcount, and one takes daily revenue and movement from the store files. Power Query handles the shaping, while VBA routines handle the collection and refresh sequence.
The daily layout needed care, because that is where many in-house attempts break. Instead of merging cells into neat day blocks, we gave each day of the month its own pair of columns for revenue and movement, from day 1 to day 31. Merged cells look tidy but calculate badly. A plain grid with one value per cell looks less elegant and calculates reliably.
How managers use the retail KPI dashboard
Here is what a normal Monday looks like with the finished retail KPI dashboard. A regional manager opens the workbook, picks a store from a drop-down list and types a start date and an end date. Nothing else is needed.
The dashboard then returns total revenue for that window, total people cost for that window, and the percentage the two produce together. Below those headline figures sit three daily curves: revenue by day, foot traffic by day and active employees by day. Reading them together is where the insight lives. A traffic peak on a thinly staffed day is a lost sale, while a staffing peak on a quiet day is lost margin.
Underneath, the file lists every worker assigned to that store, with their role, total cost and shift pattern. HR uses that view to challenge scheduling, and Finance uses the indicators above it to challenge cost. Both teams read the same file, from the same source.
Executive management gained one more layer. Because both brands now sit in an identical structure, the KPI dashboard places the two brands side by side, and nobody has to reformat anything to compare them.
Phase two: turnover and absenteeism without a rebuild
A good model tends to earn follow-up work, and this one did. In a later phase, the client asked us to add two HR indicators: turnover and absenteeism.
Both come from store-level source files. So we extended the existing VBA import routine for the dashboard to collect the new data and applied the same open-date filtering used everywhere else. The client can now read turnover against labour cost and revenue for the same store, in the same window.
Nothing had to be rebuilt. Because the foundation layer was already structured and the refresh already automated, two new KPIs joined the dashboard while the layout the team knew stayed the same.
Results: more than 50 hours back every month
The measurable outcome was more than 50 hours of manual work removed every month across Finance, HR and Operations. Those hours used to go on exporting, pasting, reconciling and formatting.
The less visible outcome matters as much. Four departments now discuss decisions instead of arguing about whose numbers are right. When Operations questions a staffing model and Finance questions a cost ratio, both open the same workbook. Also, comparing two campaign windows now takes only as long as typing two dates.
The stack looked ahead, too. Excel 365, VBA and Power Query gave the client a tool their teams could run straight away on software they already licensed. At the same time, the data model is clean enough to move into Power BI when volume demands it.
By building one retail KPI dashboard in Excel around ratios such as labour cost as a share of revenue, Sapphire Business Technology saved two apparel brands more than 50 hours of manual work a month.
How to build a retail KPI dashboard in Excel: step by step
You can apply the same method with the tools you already have. The steps below follow the order we used on this project.
- List your sources and what each one contains. Write down where revenue, foot traffic, payroll and attendance data come from, and in what format each arrives.
- Create a store dictionary. On one sheet, give each store one row with its fixed details, such as name, category and size. Every other sheet should refer to stores by this exact name or code.
- Give each source its own import sheet. Keep raw exports on separate sheets and never type over them. Do your calculations elsewhere.
- Use Power Query to load and clean the data. In Excel, go to Data, then Get Data, connect to each export and let the query repeat the same cleaning steps every time. If your exports share the same columns and sit in one folder, combine them in a single query; if each source has a different layout, build one query per source.
- Avoid merged cells. Keep one value per cell so formulas and filters work across every day of the month.
- Calculate ratios, not just totals. Add labour cost as a percentage of revenue for every store. Totals tell you size, whereas ratios tell you efficiency.
- Add a store selector and two date cells. Use a drop-down list for the store and two cells for the start and end dates. Then make every KPI follow that range rather than a fixed month.
- Chart the daily curves together. Plot revenue, foot traffic and staff on duty by day, next to each other, so peaks and gaps are easy to spot.
- Decide how refresh will work. If one person refreshes the file once a week, Data then Refresh All is usually enough. If several sources arrive at different times or must load in a fixed order, a short VBA routine can run the whole sequence with one button.
The lesson: design around ratios, not totals
Microsoft describes Power Query as the data connectivity and preparation technology that lets users import and reshape data inside products such as Excel and Power BI. That is exactly why we used it here. The same queries that feed the Excel model today can feed a Power BI report later.
Our experience adds a point the documentation does not make. Clean data is necessary, but clean data is not the insight. In multi-store retail, the useful question is rarely “how much?” It is “how much, relative to what?” Labour cost only makes sense against revenue, and staffing only makes sense against traffic.
That principle travels well. Whether you run two brands or twenty stores, design your retail KPI dashboard around ratios and open date ranges first, and build the charts last. If you reverse that order, you get a dashboard that looks complete but still cannot answer the question your managers ask on Monday morning.
Need a retail KPI dashboard built for you?
The steps above work for a handful of stores and a few clean sources. However, once you are merging payroll, attendance and sales exports across several brands, the build takes time and mistakes get expensive. A professional solution shortens that path.
Our Excel specialists build custom spreadsheets and automated reporting models like this one, ready to move into Power BI when you need it. If you would rather have the result than the project, see how our Excel reporting service can turn your separate files into one retail KPI dashboard.
Want every store, brand and date range in one workbook? Send us a short description of your stores and the exports you work with.
Frequently asked questions
What is a retail KPI dashboard?
Which data sources did the dashboard combine?
Why lead with labour cost as a percentage of revenue?
What results did the two brands see?
Can the model move into Power BI later?
This case study was written by Sapphire Business Technology, drawing on its experience with 500+ clients and 2,000+ projects in Excel, Power Query and Power BI.